Skip to content
GitHub
6.5k
v1.2.0-beta.1

The open-source observability database

Metrics, logs, and traces
in one database.
Running on your infrastructure.

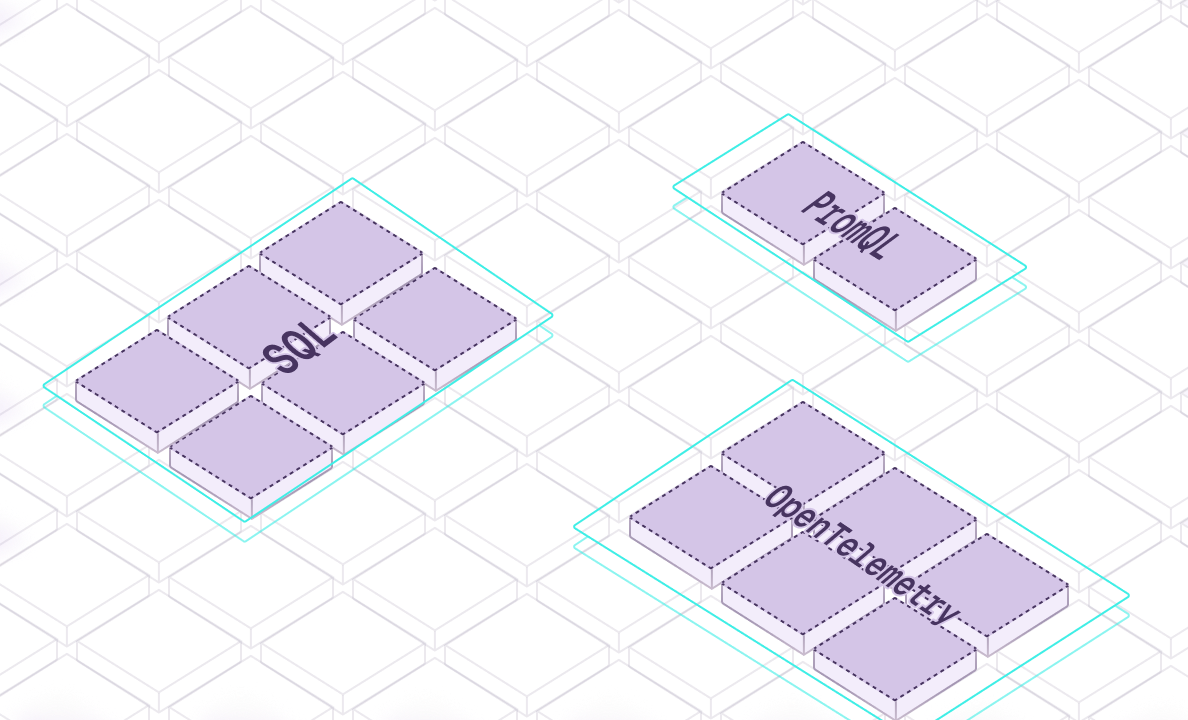
A columnar engine with object storage as primary storage. Ingest through OpenTelemetry and Prometheus Remote Write, query observability data with SQL and metrics with PromQL.

Streaming
Storage

THREE SYSTEMS

Three backends, three scaling models

  • Ingestion and retention are configured per signal
  • Each backend scales and fails differently
  • Cross-signal investigation spans multiple query languages
  • At scale, real-time monitoring and historical analysis need separate capacity plans
  • More components to deploy, upgrade, secure, and observe
VS
ONE ENGINE →

One engine, one table model

  • Metrics, logs, and traces share one table model: tags, timestamp, fields
  • Store raw events and derive metrics on demand, or materialize them continuously with Flow
  • Correlate signals in one SQL query when they carry common identifiers
  • Recent data and long retention are served by the same engine — no separate analytics stack
  • Up to 50× lower storage cost through compression and object storage

Bring your own protocols

Ingest through OpenTelemetry, Prometheus Remote Write, Loki Push, and Elasticsearch Bulk. Query observability data with SQL and metrics with PromQL. Migrate ingestion one signal at a time without rebuilding your collectors.

Data sources
Metrics
Traces
Logs
Standard
Open Protocols
OpenTelemetry
Prometheus Remote Write
Loki Push
Elasticsearch Bulk
Standard
Ingest Protocols
In-Database Computing
Preprocessing
Pipeline
Streaming &
Materialized View
Alerting/Trigger Rules
GreptimeDB
Compacted and Compressed Low-cost Scalable Data Storage
Object Storage
Applications
APM
Dashboard
O11y Data Analytics
AI & Machine Learning
Alerting
Standard
Protocols & Drivers
SQL
PromQL
Fast and Flexible
Query options

Why now: agents

Agents are changing both sides of observability. Agentic applications emit high-cardinality telemetry. Investigation agents explore that same data in parallel — a different concurrency profile than a dashboard ever produced. Both need the same thing underneath: one place to write it and one place to query it.

Human

Linear drill-down

Each step waits for a result before the next one is chosen.

  1. 1Check the dashboard
  2. 2Drill into a service
  3. 3Read its logs
  4. 4Jump to a trace

Correlation happens in the engineer's head.

Agent

Parallel fan-out

Many queries at once. Branches that miss get dropped, the ones that hit go deeper.

agent

Branches abandoned halfway

Read the articleObservability Is Converging. Humans Aren't the Only Ones Querying It Anymore.

GreptimeDB is Trusted By

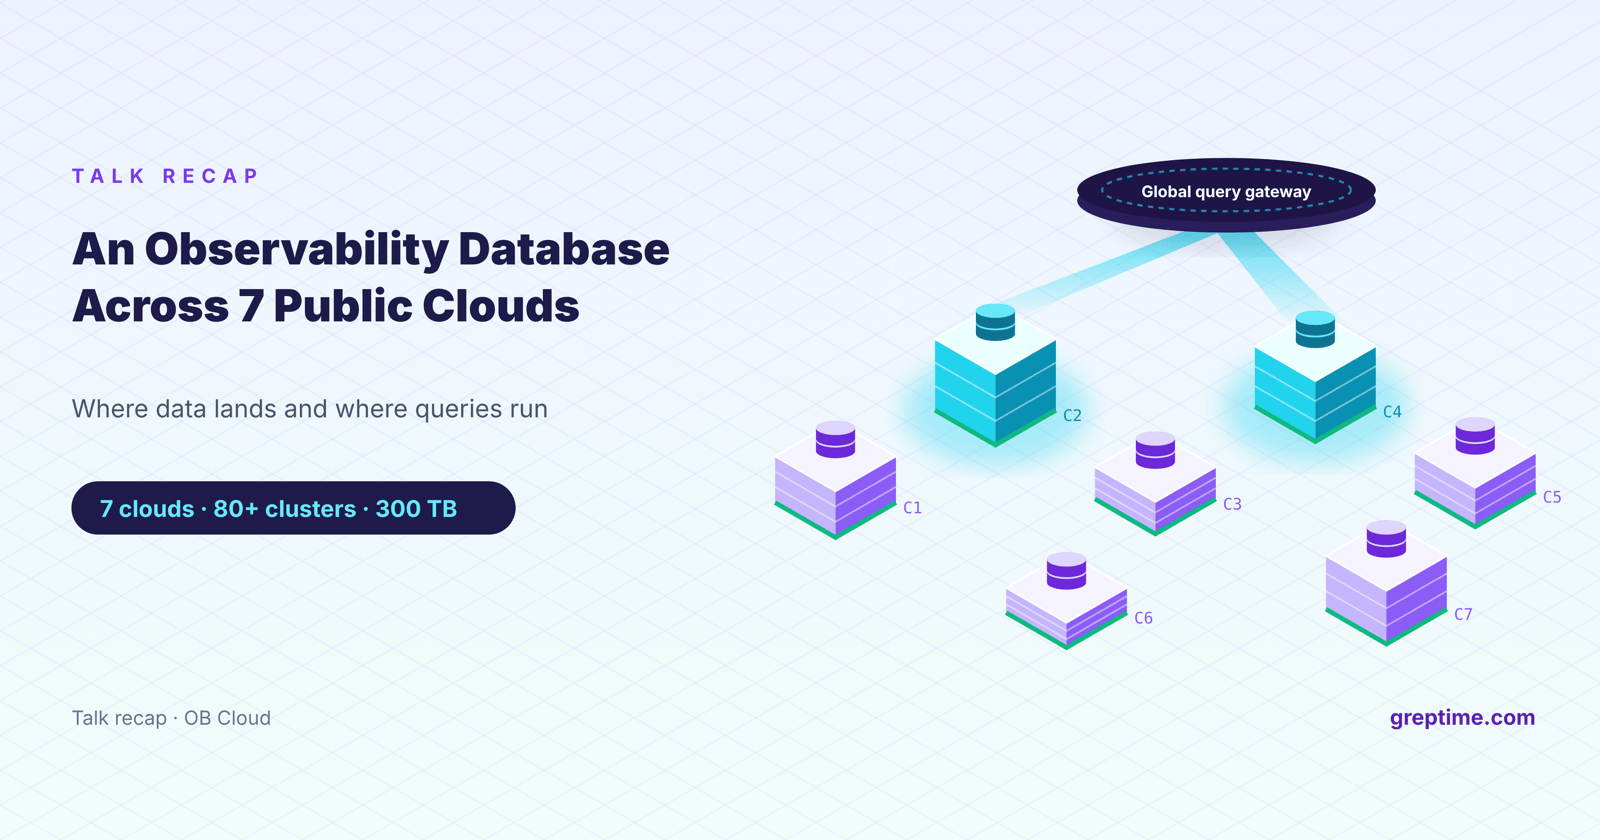
Migrate Loki to GreptimeDB
OceanBase Cloud
Staff Engineer
Learn more
Migrating from Loki to GreptimeDB enables high-performance querying of massive log data at scale, offers multi-cloud deployment flexibility, and significantly simplifies application and deployment architecture.
Production Scale
300TBincrease
Storage Cost Reduction
60%+decrease
Query Latency
Sub-second on a full day of logs

What one engine actually buys you

One system for the hot path and for history

One system for the hot path and for history

  • Recent data is served from memory and local-disk caches; long retention lives on object storage — same engine, same SQL

  • Retention policies, downsampling, and continuous aggregation are database features, so derived metrics do not need a second pipeline

  • Inverted, skipping, and fulltext indexes; distributed tables partition by column ranges

Keep long-retention data on object storage

Keep long-retention data on object storage

  • Object storage as primary — S3, GCS, Azure Blob, and S3-compatible endpoints

  • Up to 50× lower storage cost through compression and object storage

  • OceanBase Cloud: 300 TB of logs, 60%+ lower storage cost after migrating off Loki

Scale on your infrastructure

Scale on your infrastructure

  • Compute and storage are disaggregated

  • One binary, from a single node to a 100-node Kubernetes cluster

  • Enterprise adds read replicas, workload isolation, automated repartitioning, and region load balancing

Plan That Fits Your Needs

Enterprise User?

Contact us
Open source

Open source

One columnar engine for metrics, logs, and traces, backed by object storage. SQL across observability data, PromQL for metrics. Apache-2.0 licensed core.

  • Production-ready standalone or cluster deployment

  • Retention, downsampling, and continuous aggregation built in

  • Community-driven, open governance

Enterprise

Enterprise

Scale observability on your infrastructure — workload isolation, independent read capacity, automated repartitioning and region load balancing, HA, and support.

  • Mission-critical systems monitoring and analytics

  • Higher performance and data governance

  • Industries requiring high security and compliance (finance, healthcare etc.)

  • Organizations needing automated operations and intelligent resource scheduling

  • Teams that need data to stay in their own environment, with enterprise support