On this page
During an intensive stress test, we noticed an abnormal phenomenon: the memory of GreptimeDB's Frontend node was consistently increasing even when the request number is stable, until an OOM(Out Of Memory) kill occurred. This pointed towards a potential memory leak in the Frontend and marked the beginning of our memory leak investigation.
Visualizing the memory usage with heap profiling in GreptimeDB
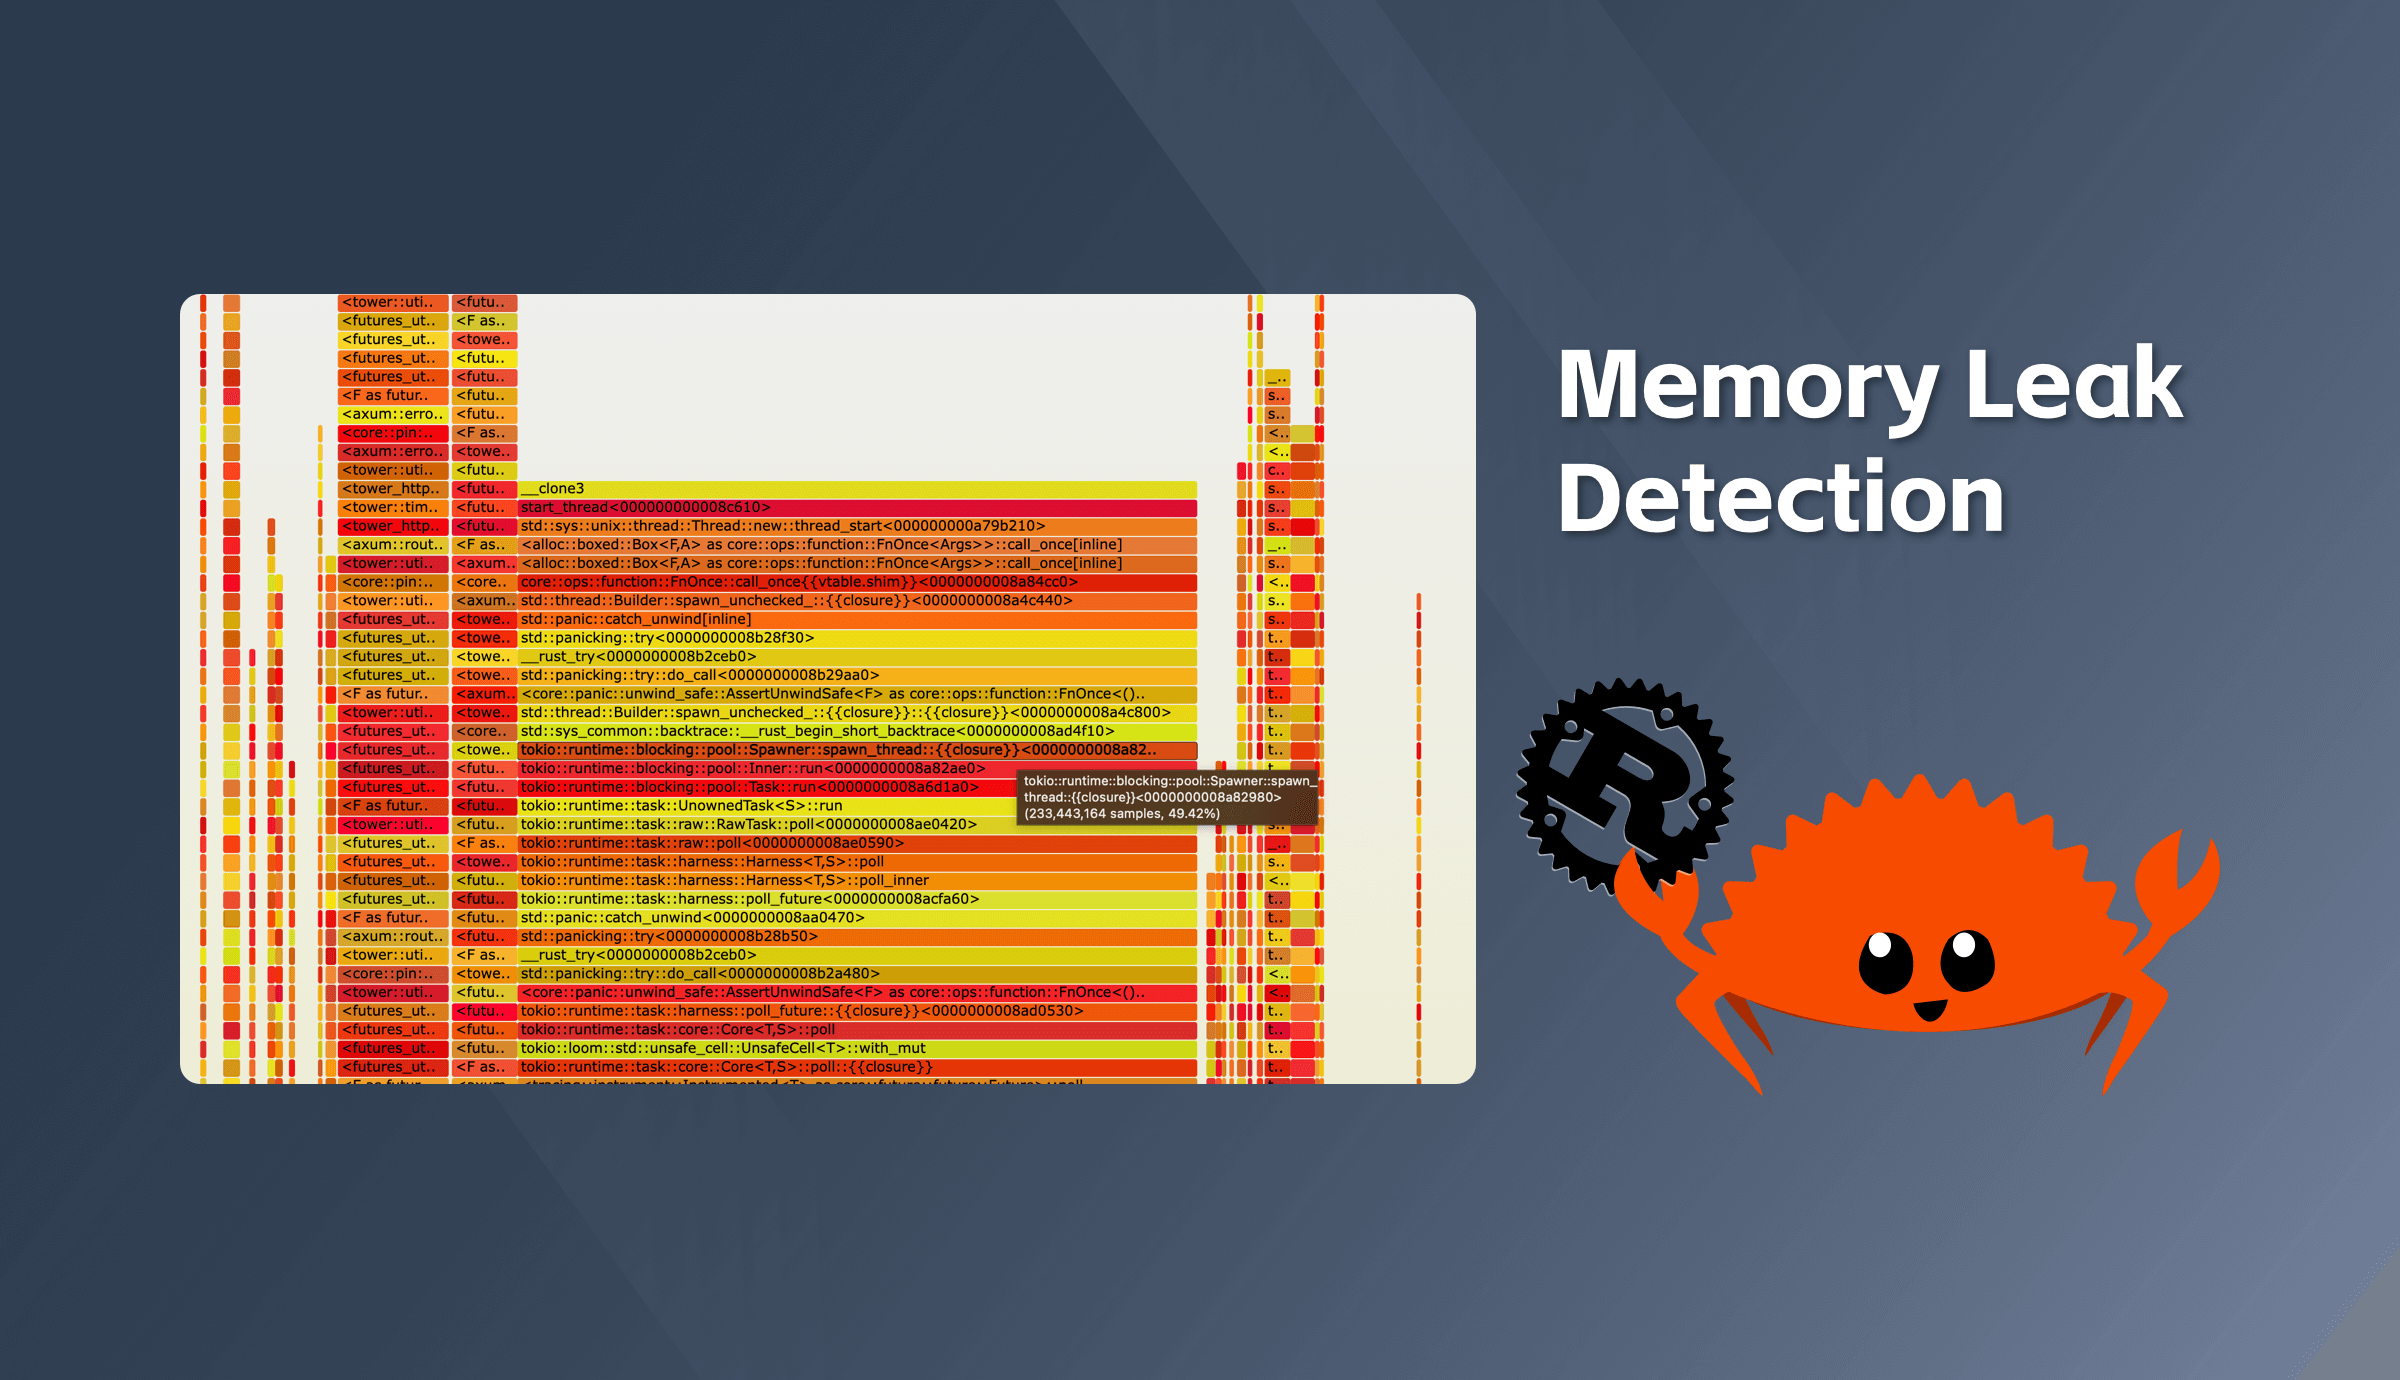
In mega projects, identifying a memory leak solely by code review is typically unfeasible. As such, our first step was to statistically analyze our project's memory usage. Thankfully, GreptimeDB employs jemalloc, which includes built-in heap profiling and we also support exporting profile dump files of jemalloc. When the memory usage of the Frontend node hits 300MB and 800MB, we dumped the corresponding memory profile files. Then utilized jemalloc's built-in jeprof tool to examine the memory differences (--base parameter), and visualized the results using a flame graph:
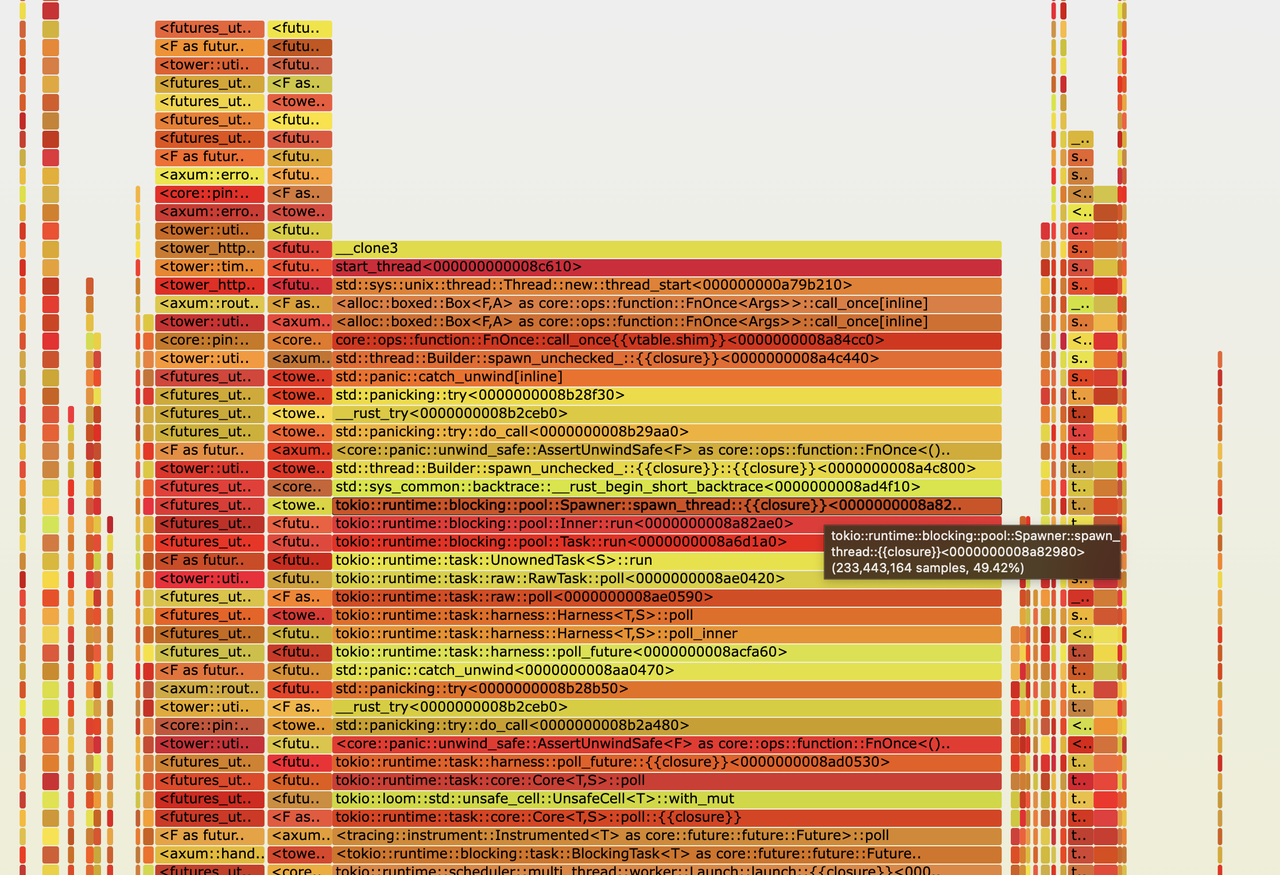
A conspicuous block in the center of the picture represented a continuously increasing 500MB memory usage. A closer inspection revealed thread-related stack traces. We wondered if excessive threads were being created.
However, upon executing the ps -T -p command on the Frontend node's process, it was observed that the thread count was a stable 84, which was in line with expectations. Consequently, we can eliminate the scenario of "excessive threads".
Upon further examination, we encountered numerous stack traces related to tokio runtime. This discovery suggested the possible occurrence of tokio task leaks, another common type of memory leak. To verify our suspicions, we turned to the tokio-console, a powerful tool for detailed analysis and monitoring of tokio tasks.
Analyzing the memory leak with Tokio console
Tokio Console is an official diagnostic tool from Tokio. After looking into the condition of tokio tasks using Tokio Console, we saw the following results.
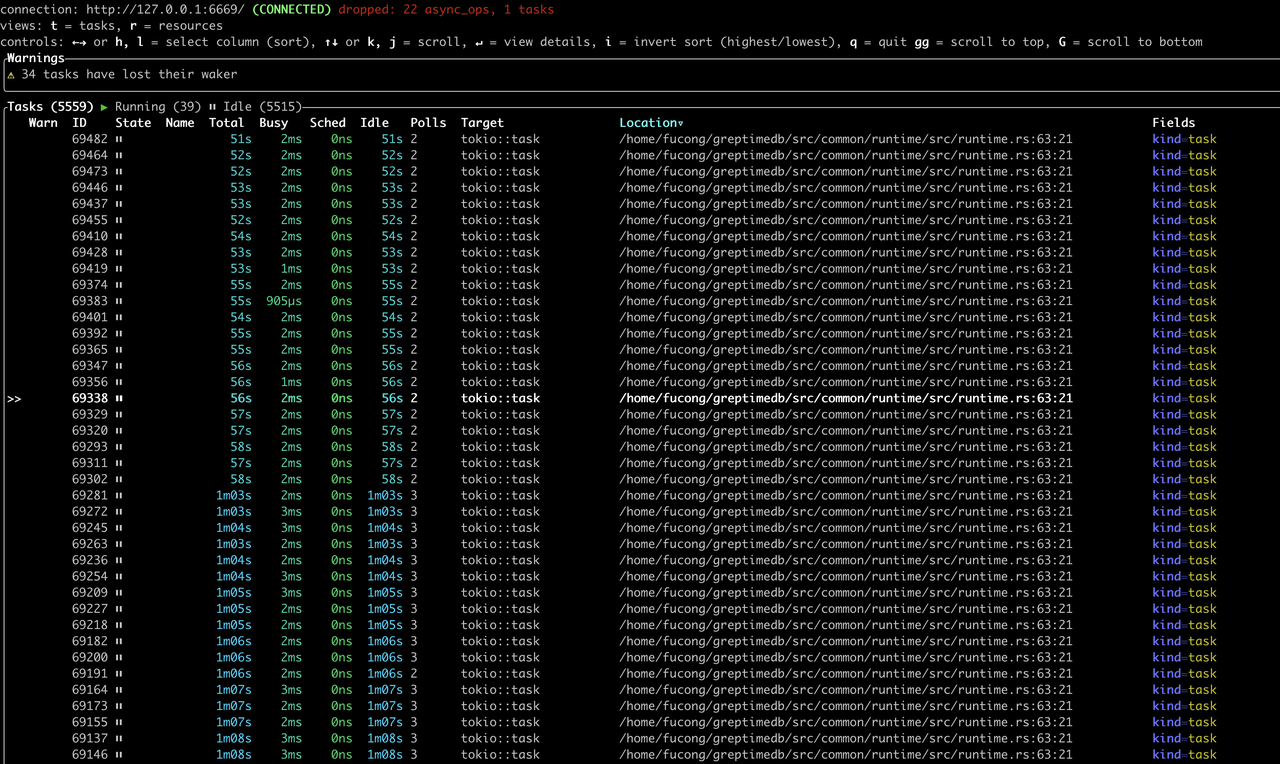
The results were astonishing - we had a staggering 5559 tasks, with most of them idling. This evidence corroborated our suspicion that the memory leak was indeed stemming from tokio tasks. This led us to our next challenge: identifying where exactly within GreptimeDB's code were these numerous, persistent tokio tasks being spawned.
The "Location" column in the above figure pointed us towards the place where the tasks were being spawned:
impl Runtime {
    /// Spawn a future and execute it in this thread pool
    ///
    /// Similar to tokio::runtime::Runtime::spawn()
    pub fn spawn<F>(&self, future: F) -> JoinHandle<F::Output>
    where
        F: Future + Send + 'static,
        F::Output: Send + 'static,
    {
        self.handle.spawn(future)
    }
}
The next step was to identify all code within GreptimeDB that called this method.
Identifying the root cause in Rust syntax
After careful code review, we identified the root cause of the tokio task leak and addressed it in PR #1512. In essence, we spawned a tokio background task in the constructor of a frequently used struct. However, we failed to recycle the background tasks while dropping those structs.
It's worth noting that creating a task in a constructor isn't inherently an issue, provided it is properly terminated when the struct is dropped. However, in this case, our oversight of this crucial step led to the memory leak.
The Hidden Pitfalls of .Default::default() in Constructors
Furthermore, the same constructor was invoked in the struct's Default::default() method, which compounded the complexity of pinpointing the root cause.
Rust offers a convenient "Struct Update Syntax" for constructing a struct using another struct. If a struct implements Default, we can simply employ ..Default::default() in the field's construction. If Default::default() has some "side effects" (like spawning a background tokio task, which caused our memory leak), caution is required: once the struct is constructed, the temporary struct created by Default is discarded, hence appropriate resource recycling is crucial.
Here's a simple example from Rust Playground:
struct A {
    i: i32,
}

impl Default for A {
    fn default() -> Self {
        println!("called A::default()");
        A { i: 42 }
    }
}

#[derive(Default)]
struct B {
    a: A,
    i: i32,
}

impl B {
    fn new(a: A) -> Self {
        B {
            a,
            // A::default() is called in B::default(), even though "a" is provided here.
            ..Default::default()
        }
    }
}

fn main() {
    let a = A { i: 1 };
    let b = B::new(a);
    println!("{}", b.a.i);
}
The default method of struct A is invoked, printing it out as called A::default().
Summary
- To detect memory leaks in Rust programs, we can leverage jemalloc's heap profiling to export dump files. Flame graphs can be generated to provide an insightful visualization of memory usage.
- The tokio-console efficiently displays the operational status of tokio runtime tasks. Keep a keen eye out for the accumulation of idle tasks as it could be a warning sign.
- Abstain from incorporating code that produces side effects within constructors of regularly used structs.
- The
Defaulttrait should only be used for value-type structs.
References
- Heap Profiling: Heap profiling is a way to collect and analyze an application's heap allocations to help identify issues like memory leaks and inefficiencies. Learn more about the use case here.
- Tokio Console: Tokio Console is an official diagnostic tool from Tokio. Learn more here.
- Related Issue fixed: tokio task leak fixed with enabling tokio console in cluster mode
About Greptime
Greptime offers industry-leading time series database products and solutions to empower IoT and Observability scenarios, enabling enterprises to uncover valuable insights from their data with less time, complexity, and cost.
GreptimeDB is an open-source, high-performance time-series database offering unified storage and analysis for metrics, logs, and events. Try it out instantly with GreptimeCloud, a fully-managed DBaaS solution—no deployment needed!
The Edge-Cloud Integrated Solution combines multimodal edge databases with cloud-based GreptimeDB to optimize IoT edge scenarios, cutting costs while boosting data performance.
Star us on GitHub or join GreptimeDB Community on Slack to get connected.


