On this page
OpenTelemetry is dedicated to offering a set of APIs and SDKs that assist cloud-native applications in establishing standardized Observability capabilities which can be implemented independently. Among its offerings, OTLP is a protocol for encoding and transmitting Observability data. Notably, in July, the OTLP protocol officially launched its 1.0.0 version. To facilitate users collecting Observability data with the OpenTelemetry framework, we now support OTLP Metric data writing in GreptimeDB.
What is OTLP
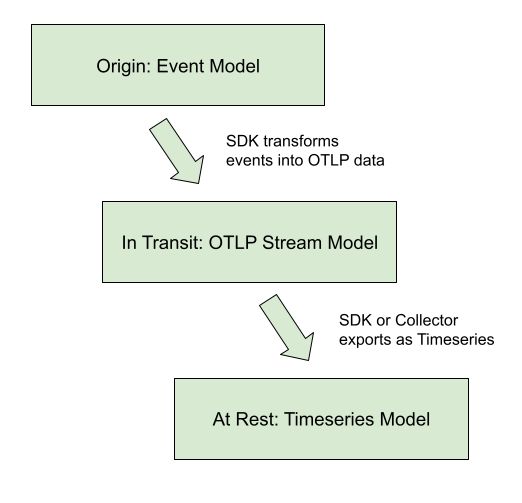
OpenTelemetry defines the lifecycle of Observability data into three stages: Origin, In Transit, and At Rest. OTLP bridges the process between the Origin and At Rest, modeling data types in the Observability field and defining the relevant data request protocols.
In today's market, though there's an abundance of transmission protocols tailored for Observability data, it's intriguing to see that many originate from distinct implementations. For instance, InfluxDB has its distinct line protocol, and Prometheus features its scrape output. As a neutral protocol, OTLP ensures that users are not tied to any particular ecosystem.
OTLP supports three primary types of Observability data:
- Metrics
- Logs
- Traces
For methods of collection and transmission, OTLP allows:
- gRPC
- Protobuf over HTTP
- JSON over HTTP.
Additionally, OTLP aligns with the OpenTelemetry standard's abstraction of SDKs, encompassing concepts such as Resource and Instrumentation for richer metadata capture. OTLP offers client implementations in various languages, including Java, Python, Go, JavaScript, Rust ,etc. for swift integration.
GreptimeDB as Your Go-To OTLP Metrics Collector
In our latest build, GreptimeDB supports ingestion of OTLP/HTTP Metric data. Now, users collecting Observability data with the OpenTelemetry framework can directly configure GreptimeDB as their collector within their code.
Below are the conventions that the OTLP metrics data models adhere to when aligning with GreptimeDB's data model:
- The Metric name is designated as the table name in GreptimeDB, and if the table doesn't exist, it will be automatically created.
- All attributes, spanning from the resource, scope, to data_point levels, are all represented as tags in the GreptimeDB table.
- The timestamp of each data point serves as the timestamp index in GreptimeDB, with the column name
greptime_timestamp. - Data from both the Gauge and Sum types is designated as the 'field' column, named
greptime_value. - For the Summary type, each quantile is considered as an independent data column, named
greptime_pxx, where "xx" stands for the quantile value, such as 90 / 99. - Currently, Histogram and ExponentialHistogram are not supported. However, we might consider native support of Histogram data type in upcoming releases to cater to these two types.
From Theory to Practice
Taking Java as an example, you can configure your OpenTelemetry SDK to periodically collect data and send it to the OTLP/HTTP collector endpoint of GreptimeDB.
java
  static OpenTelemetry initOpenTelemetry() {
    // Include required service.name resource attribute on all spans and metrics
    Resource resource =
        Resource.getDefault()
            .merge(Resource.builder().put(SERVICE_NAME, "OtlpExporterExample").build());

    PeriodicMetricReader metricReader =
        PeriodicMetricReader.builder(
                OtlpHttpMetricExporter.builder()
                    // Use your GreptimeDB address here
                    .setEndpoint("http://127.0.0.1:4000/v1/otlp/v1/metrics")
                    .build())
            .setInterval(Duration.ofMillis(5000))
            .build();

    SdkMeterProvider meterProvider =
        SdkMeterProvider.builder().setResource(resource).registerMetricReader(metricReader).build();

    OpenTelemetrySdk openTelemetrySdk =
        OpenTelemetrySdk.builder().setMeterProvider(meterProvider).buildAndRegisterGlobal();

    Runtime.getRuntime().addShutdownHook(new Thread(openTelemetrySdk::close));

    return openTelemetrySdk;
  }
Directly utilize the OpenTelemetry API to collect metric data, for instance:
java
OpenTelemetry openTelemetry = initOpenTelemetry();

Attributes attrs = Attributes.builder().put("host", "testhost").build();

Meter sampleMeter = openTelemetry.getMeter("io.opentelemetry.example.metrics");
sampleMeter
    .gaugeBuilder("jvm.memory.free")
    .setDescription("Reports JVM memory usage.")
    .setUnit("byte")
    .buildWithCallback(result -> result.record(Runtime.getRuntime().freeMemory(), attrs));
Metrics collected are written to GreptimeDB every 5 seconds. Since GreptimeDB is compatible with the MySQL protocol, we can use a MySQL client to retrieve the data:
MySQL [public]> select * from jvm_memory_free;
+---------------------+------------------------+--------------------+-----------------------+----------+-------------------------+----------------+
| service_name        | telemetry_sdk_language | telemetry_sdk_name | telemetry_sdk_version | host     | greptime_timestamp      | greptime_value |
+---------------------+------------------------+--------------------+-----------------------+----------+-------------------------+----------------+
| OtlpExporterExample | java                   | opentelemetry      | 1.28.0                | testhost | 2023-08-14 15:55:55.938 |      221367384 |
| OtlpExporterExample | java                   | opentelemetry      | 1.28.0                | testhost | 2023-08-14 15:56:00.936 |      235219040 |
| OtlpExporterExample | java                   | opentelemetry      | 1.28.0                | testhost | 2023-08-14 15:56:05.937 |      235219040 |
+---------------------+------------------------+--------------------+-----------------------+----------+-------------------------+----------------+
3 rows in set (0.011 sec)
Conclusions
Notably, beyond being a data protocol rich in information tailored for Observability scenarios, OTLP also stands out as a typical push-based protocol. This facilitates users in directly writing data from applications into GreptimeDB. As GreptimeDB broadens its data type and scenario support, we anticipate an even deeper integration with other data types of OTLP.
GreptimeCloud now also supports OTLP protocol. Users can experience the OTLP metric collector on GreptimeCloud by either setting up a new instance or using an existing one. Additionally, we've curated OTLP samples in various languages to assist users in getting started swiftly.
Should you encounter any question or have any suggestion, you can always find us on Slack!


