On this page
Last month, our implementation of the GreptimeDB Sink for the Vector project has been successfully merged. With the recent release of Vector 0.32.0, Vector has officially integrated GreptimeDB as a metrics data Sink. This allows users to channel data from various sources into GreptimeDB using Vector, marking a significant milestone for GreptimeDB in the observability ecosystem.
What is Vector?
Vector is an "observability data pipeline" written in Rust, facilitating the transfer of observability data, metrics and logs.
Within Vector's abstraction, three main modules are defined:
- Sources
- Transforms
- Sinks
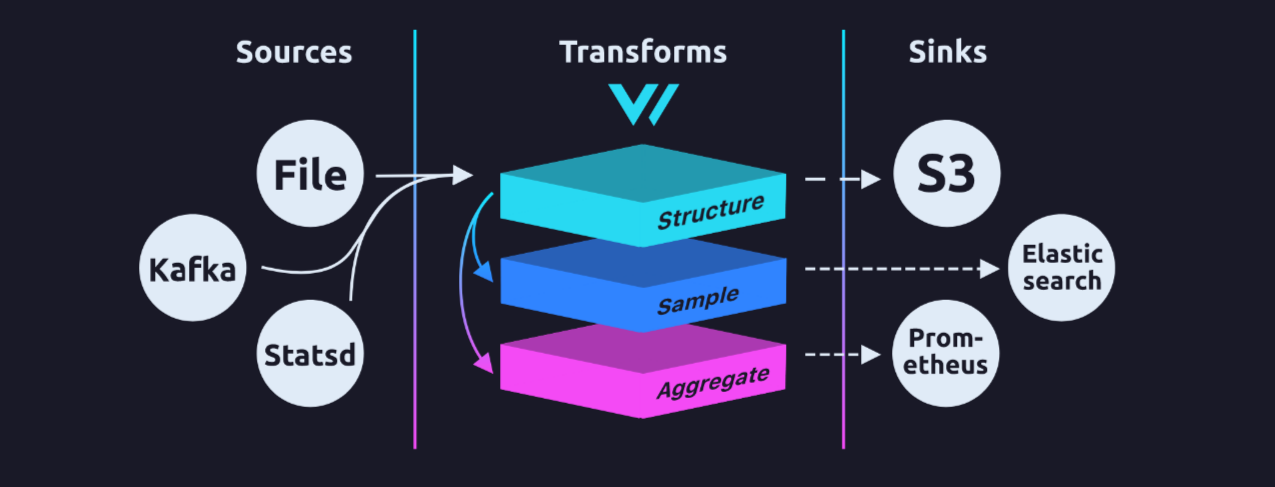
In a Vector topology, users can specify multiple Sources, Transforms, and Sinks through configuration. They can also define the data flow between them, ensuring seamless data transportation and processing from Sources to Sinks. Vector ships over 40 data sources and more than 50 sinks, including GreptimeDB. Transforms, a unique feature of Vector, enable data remapping, aggregation, filtering, downsampling, rate-limiting, and even the conversion between Metrics and Logs.
Internally, besides integrating various data source and destination clients, Vector abstracts and models the data transfer process, offering a uniform infrastructure that supports batch operations, retries, TLS encryption, traffic management, etc. By adhering to its design standards, one can develop reliable extensions.
GreptimeDB as a Vector Sink
Currently, GreptimeDB can serve as a metrics data sink for Vector. With Vector’s transforms, Logs can also be converted into Metrics as required by the business, and then stored in GreptimeDB.
When storing Vector metrics in GreptimeDB, we follow the following rules:
Combine the Metric’s namespace and name using underscores as GreptimeDB’s table name
Use the timestamp from the Metric as the time index in GreptimeDB, with a default column name
tsTags associated with the Metric will be used as GreptimeDB’s tag field
Vector's metrics, much like other metrics, come in various subtypes:
- For Counter and Gauge metric types, values are directly stored in the
valcolumn. - For the Set type, the count of data points in the set is stored in the
valcolumn. - Distribution type metrics store each percentile value in the
pxxcolumn, where "xx" represents the quantile value. Columns for min, max, avg, sum, and count are also recorded. - For the AggregatedHistogram type, each bucket's value is stored in the
bxxcolumn, with "xx" indicating the upper limit of the bucket value. We also keep track of the sum and count columns. - The AggregatedSummary type follows a similar structure, storing each percentile value in the
pxxcolumn, with "xx" denoting the quantile value. Columns for sum and count are also recorded. - For the Sketch type, each percentile value is stored in the
pxxcolumn, again with "xx" indicating the quantile value. Columns for min, max, avg, and sum are also recorded.
- For Counter and Gauge metric types, values are directly stored in the
A Practical Example First, make sure that you have a running GreptimeDB instance. It can either be based on the open-source version or an instance opened on GreptimeCloud.
Download Vector 0.32 version and write a configuration file. Here we use Vector's host_metrics data source as an example:
toml
[sources.in]
type = "host_metrics"
scrape_interval_secs = 30

[sinks.local]
inputs = ["in"]
type = "greptimedb"
endpoint = "localhost:4001"

[sinks.cloud]
inputs = ["in"]
type = "greptimedb"
endpoint = "7x5hdjl32d17f.us-west-2.aws.greptime.cloud:4001"
dbname = "..."
username = "..."
password = "..."
Within this configuration file, both the local GreptimeDB and the serverless instance on GreptimeCloud are utilized. Simply configure the endpoint to the instance's 4001 port, and then set the name, username, password, and related parameters of the database.
Save the configuration file as sample.toml and launch Vector for data write in:
toml
vector -c sample.tomlAccess the data via the MySQL protocol:
plaintext
MySQL [etox4eivxxv2respective_expansion-public]> select * from host_load1 order by ts desc limit 5;
+-------------------------+-----------+----------+---------------+
| ts | collector | host | val |
+-------------------------+-----------+----------+---------------+
| 2023-08-23 06:25:32.295 | load | thinkneo | 0.88671875 |
| 2023-08-23 06:25:02.295 | load | thinkneo | 1.35302734375 |
| 2023-08-23 06:24:32.295 | load | thinkneo | 1.32763671875 |
| 2023-08-23 06:24:02.295 | load | thinkneo | 1.5029296875 |
| 2023-08-23 06:23:32.295 | load | thinkneo | 1.65966796875 |
+-------------------------+-----------+----------+---------------+
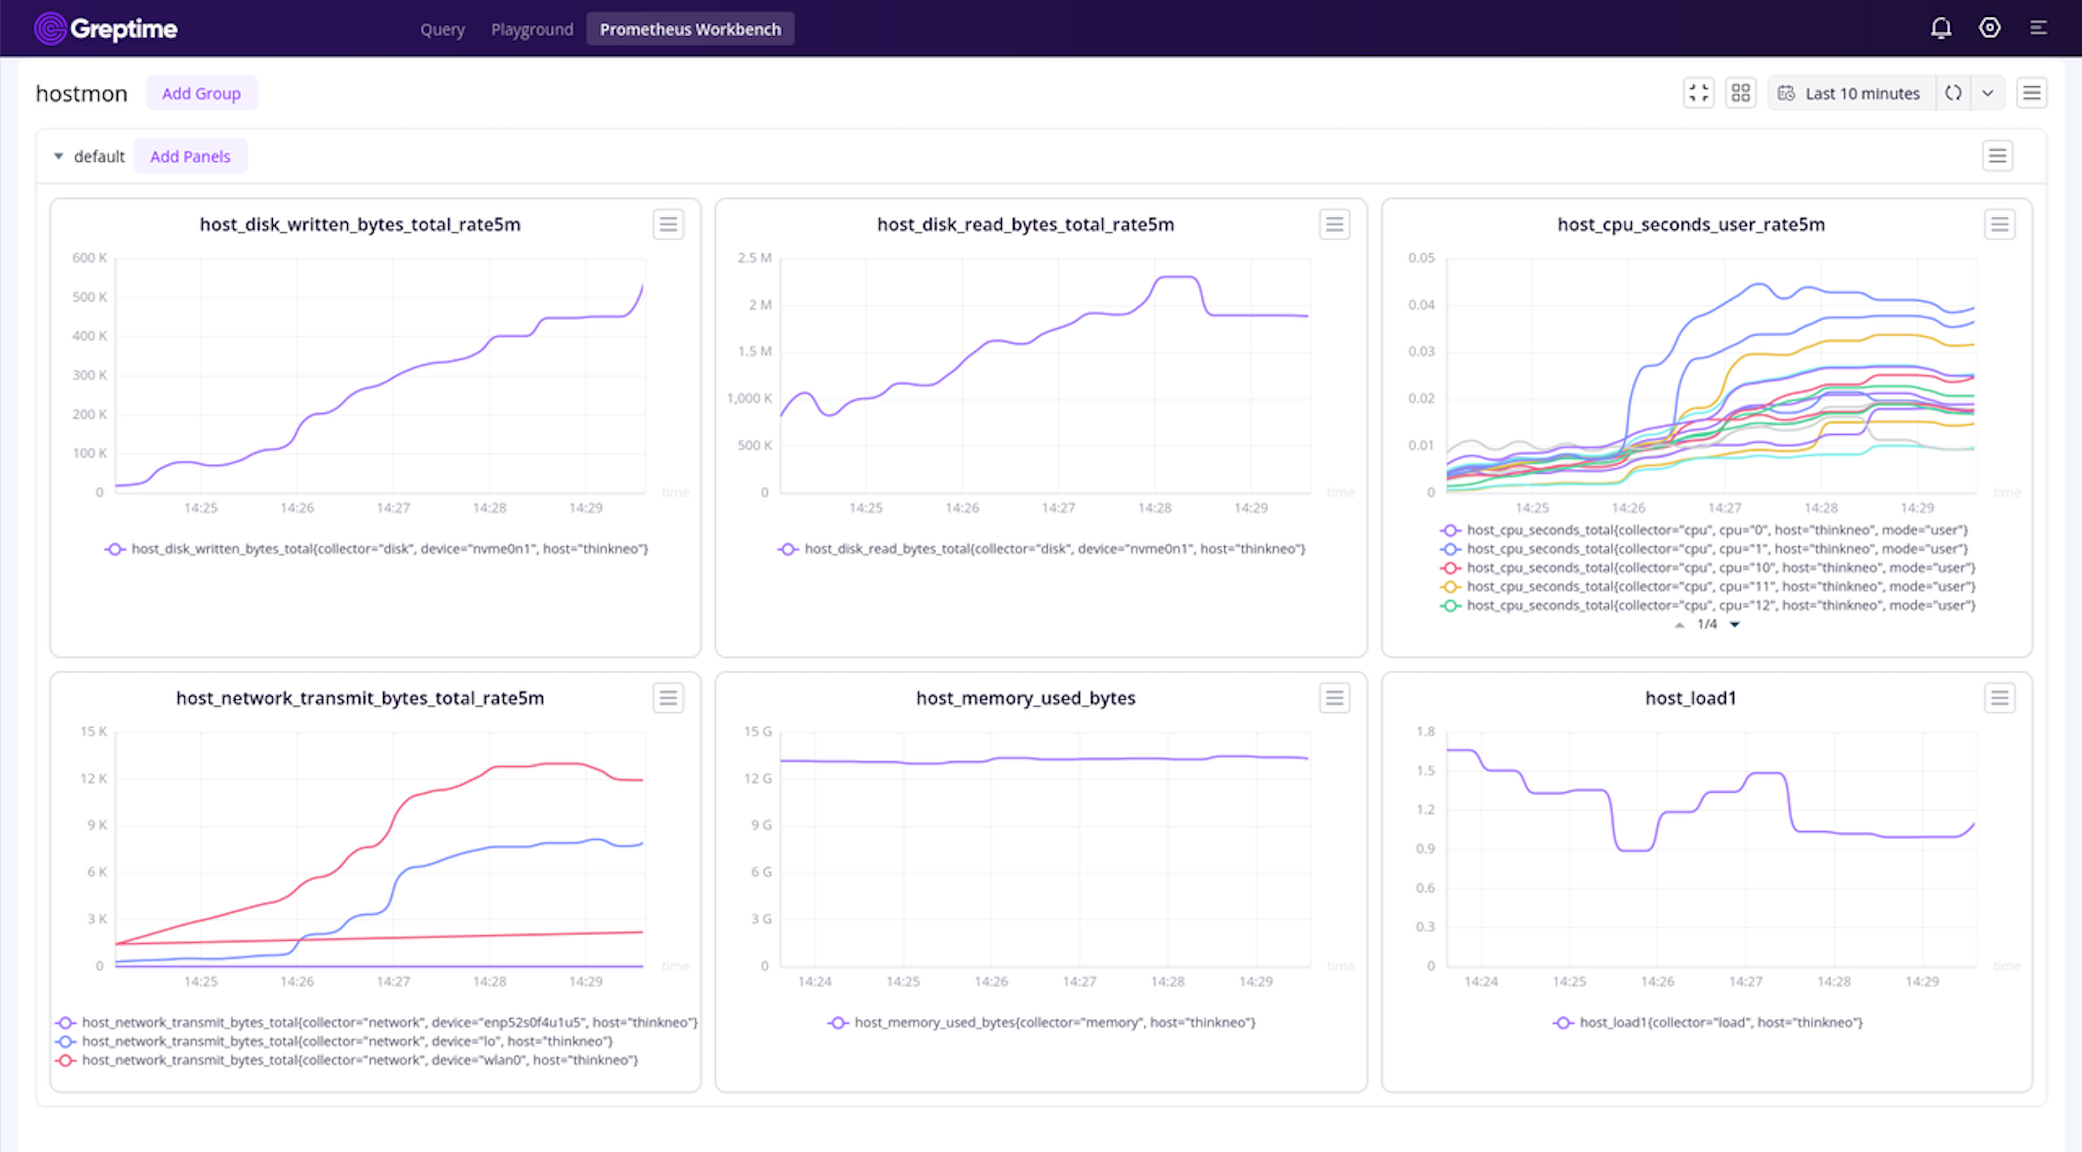
5 rows in set (0.198 sec)Visualize it on GreptimeCloud:
Conclusions
The integration with Vector extends GreptimeDB’s application in Observability. Thanks to the Vector team for their assistance during the integration process, we‘ll provide more customization options in the future.
You're welcome to give any kinds of feedback via Vector's Issue tracker or the GreptimeDB Slack community.
Register now on GreptimeCloud and download the latest version of vector to give it a try.


