GreptimeDB is a cloud-native, distributed, open-source time-series database written in Rust that seamlessly integrates storage and analysis. It primarily caters to industries that possess vast amounts of time-series data and can benefit from the analytical results of this data, some typical industries include finance, IoT (Internet of Things), autonomous driving, and IT infrastructure monitoring, etc.
Since being released as open-source on GitHub in November 2022, GreptimeDB has progressed from version v0.1 to v0.4, consistently advancing towards maturity. We recommend version v0.4 as the first suitable for production deployment. Setting up GreptimeDB is straightforward. Let's dive into how to download and initiate GreptimeDB from the ground up.
Installation and Startup
First, you need to install GreptimeDB to your environment.
Currently, there are three methods you can choose from to install GreptimeDB:
- Direct binary launch
- Deploy through the Docker container
- Launch on Kubernetes (for cluster mode)
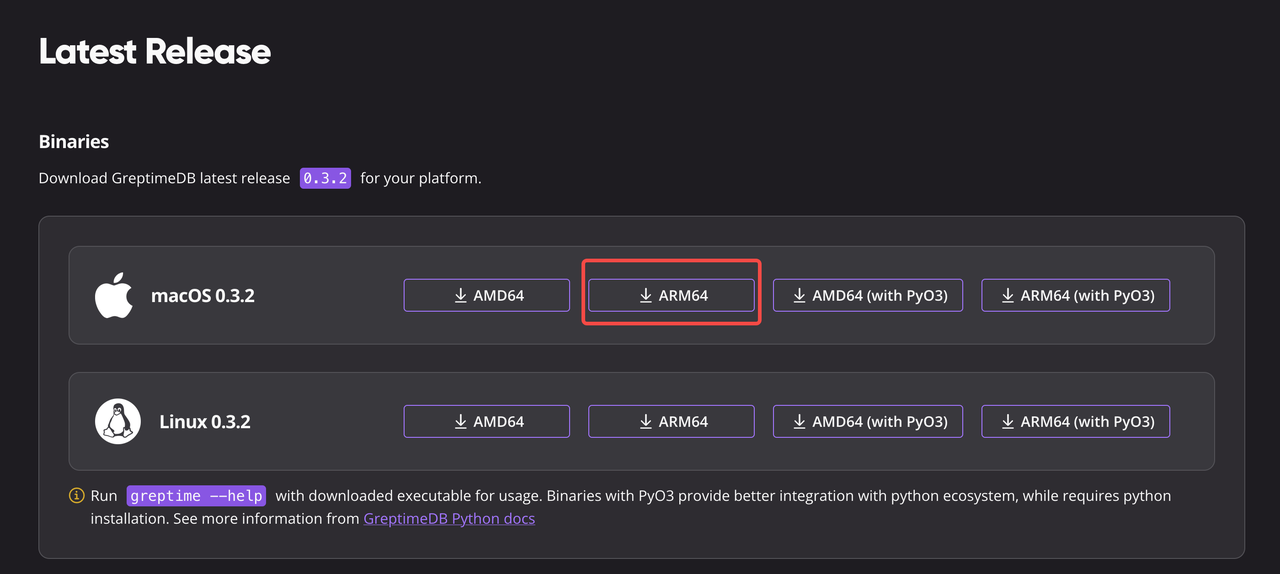
You can find the download files for these three methods on our official website, Greptime Download. We provide the latest stable release there, and for those eager to experience the very latest, Nightly build versions are also available.
I'll now demonstrate the installation using the latest stable binary tailored for the Apple M1 chipset. (Please ensure you select the version that's appropriate for your device.)

Post-download, you receive a '.tgz' compressed archive.
khaos@bogon ~/W/s/GreptimeDB> ls -lrth
-rw-r--r--@ 1 khaos  staff    50M Sep  5 16:46 greptime-darwin-arm64.tgz
You can use a decompression tool to extract it, here I used the tar command-line tool.
khaos@bogon ~/W/s/GreptimeDB> tar zxvf greptime-darwin-arm64.tgz
x greptime
khaos@bogon ~/W/s/GreptimeDB> ls -lrth
-rwxr-xr-x@ 1 khaos  staff   128M Jul  5 01:01 greptime*
-rw-r--r--@ 1 khaos  staff    50M Sep  5 16:46 greptime-darwin-arm64.tgz
Check the help documentation (If your operating system blocks execution, you can allow it through the Security & Privacy settings):
khaos@bogon ~/W/s/GreptimeDB> ./greptime -help
greptimedb
branch: HEAD
commit: 4b580f40372c023120b4abf408caaaf8d2e06870
dirty: false
version: 0.3.2

USAGE:
    greptime [OPTIONS] <SUBCOMMAND>

OPTIONS:
    -h, --help                     Print help information
        --log-dir <LOG_DIR>
        --log-level <LOG_LEVEL>
    -V, --version                  Print version information

SUBCOMMANDS:
    cli
    datanode
    frontend
    help          Print this message or the help of the given subcommand(s)
    metasrv
    standalone
From the documentation provided, we can see that the downloaded version is v0.3.2. Given that GreptimeDB is built upon a distributed architecture, the open-source version allows for modular operation, letting you run it as separate components like datanode, frontend, or metasrv. However, if you prefer, you can also run it in standalone mode, as demonstrated in the following example:
khaos@bogon ~/W/s/GreptimeDB> ./greptime standalone start
2023-09-05T09:07:06.343240Z  INFO greptime: short_version: 0.3.2, full_version: greptimedb-HEAD-4b580f4
2023-09-05T09:07:06.343280Z  INFO greptime: command line arguments
2023-09-05T09:07:06.343286Z  INFO greptime: argument: ./greptime
2023-09-05T09:07:06.343292Z  INFO greptime: argument: standalone
2023-09-05T09:07:06.343296Z  INFO greptime: argument: start
...
2023-09-05T09:07:06.351417Z  INFO cmd::standalone: Datanode instance started
2023-09-05T09:07:06.351431Z  INFO frontend::server: Starting POSTGRES_SERVER at 127.0.0.1:4003
2023-09-05T09:07:06.351533Z  INFO servers::server: Postgres server started at 127.0.0.1:4003
2023-09-05T09:07:06.351561Z  INFO frontend::server: Starting OPENTSDB_SERVER at 127.0.0.1:4242
2023-09-05T09:07:06.351595Z  INFO servers::server: OpenTSDB server started at 127.0.0.1:4242
2023-09-05T09:07:06.351608Z  INFO frontend::server: Starting PROM_SERVER at 127.0.0.1:4004
2023-09-05T09:07:06.351760Z  INFO servers::prom: Prometheus API server is bound to 127.0.0.1:4004
2023-09-05T09:07:06.351776Z  INFO frontend::server: Starting HTTP_SERVER at 127.0.0.1:4000
2023-09-05T09:07:06.377584Z  INFO servers::http: Enable dashboard service at '/dashboard'
2023-09-05T09:07:06.377693Z  INFO servers::http: HTTP server is bound to 127.0.0.1:4000
2023-09-05T09:07:06.377704Z  INFO frontend::server: Starting MYSQL_SERVER at 127.0.0.1:4002
2023-09-05T09:07:06.377730Z  INFO servers::server: MySQL server started at 127.0.0.1:4002
2023-09-05T09:07:06.377750Z  INFO frontend::server: Starting GRPC_SERVER at 127.0.0.1:4001
2023-09-05T09:07:06.377768Z  INFO servers::grpc: gRPC server is bound to 127.0.0.1:4001
Upon seeing the above messages, congratulations, you've successfully ignited GreptimeDB.
GreptimeDB supports a wide range of connection protocols, including MySQL, PostgreSQL, and gRPC, each assigned to different ports. If you wish to modify the default port, it can be done via a configuration file or directly through startup parameters. For further details, please refer to the Greptime Configuration Guide.
Making the Connection
Next, you can connect to GreptimeDB using clients that you are familiar with. Here, we spotlight the MySQL connection:
khaos@bogon ~/W/website (sync-biweekly-report)> mysql -h 127.0.0.1 -P 4002
Welcome to the MySQL monitor.  Commands end with ; or \g.
Your MySQL connection id is 8
Server version: 5.1.10-alpha-msql-proxy Greptime

Copyright (c) 2000, 2021, Oracle and/or its affiliates.

Oracle is a registered trademark of Oracle Corporation and/or its
affiliates. Other names may be trademarks of their respective
owners.

Type 'help;' or '\h' for help. Type '\c' to clear the current input statement.
Once greeted by the above messages, you're officially in! Now you may explore with the default tables:
mysql> show tables;
+---------+
| Tables  |
+---------+
| numbers |
| scripts |
+---------+
2 rows in set (0.00 sec)
In the above results, numbers is a built-in test table, while the scripts table is designed to store custom Python scripts. For more details, you can refer to https://docs.greptime.com/user-guide/python-scripts/overview.
Dashboard
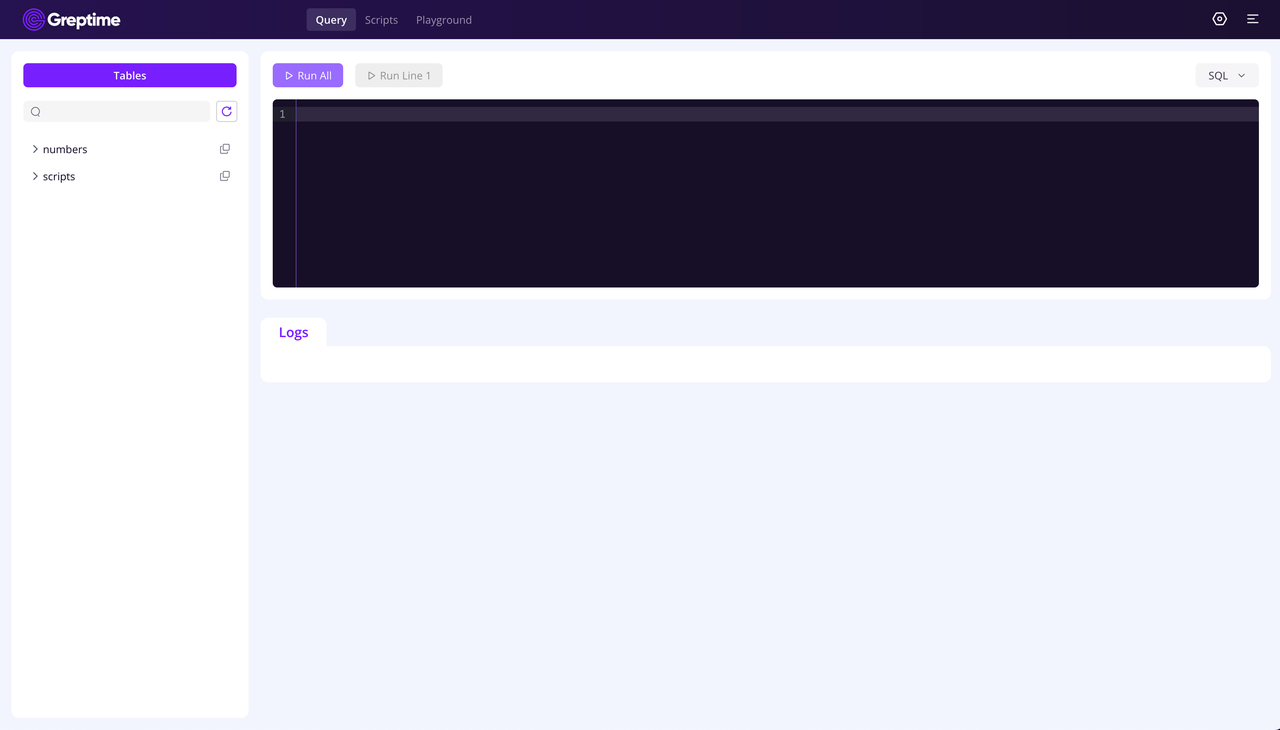
GreptimeDB enhances user experience with a built-in dashboard, granting users breezy web access. Navigate to Greptime Dashboard to explore:

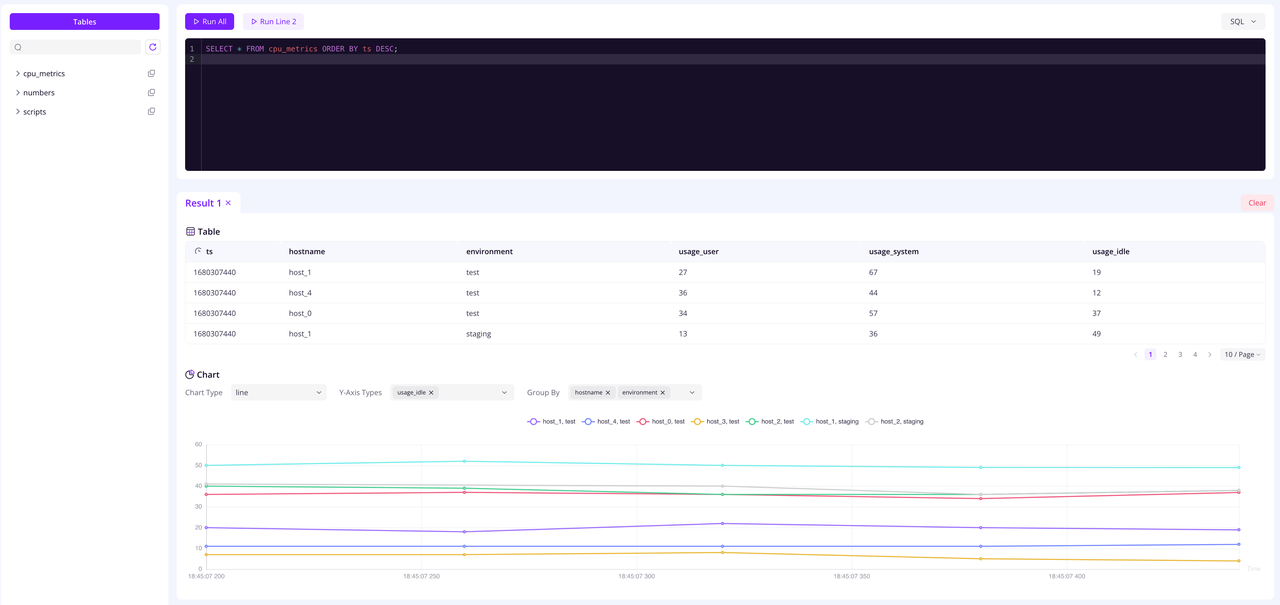
Whether you're crafting SQL commands, visualizing query outcomes, or scripting in Python, the dashboard has you covered. You can also experience the features and capabilities of GreptimeDB through our Playground, GreptimePlay.
For a sneak peek, here's a test data set crafted and displayed via the Playground:

Conclusions
At this point, GreptimeDB has been successfully installed and launched. You can access it using your preferred method, whether through a client, SDK, or API.
For more details, you can refer to our documentation: https://docs.greptime.com/getting-started/overview.


