
On this page

Background
PromQL is the query language of the Prometheus monitoring system, used for querying, analyzing, and aggregating time-series data. PromQL is known for its powerful expression capabilities, simplicity, and clear logic. As a dedicated time-series database, GreptimeDB naturally offers support for PromQL, thought in a partial capacity currently. GreptimeDB has reimplemented the parsing of PromQL in Rust and has exposed its functionalities via a well-defined interface.
Building on the API provided by GreptimeDB, we developed SDKs in various languages and also applied these interfaces to the GreptimeCloud Dashboard (we'll refer to it as Dashboard below).
Now let's briefly introduce its use in the Dashboard and JS-SDK.
GreptimeDB implements the range_query interface in the Prometheus HTTP API:
bash
curl -X GET \
  -H 'Authorization: Basic {{authorization if exists}}' \
  -G \
  --data-urlencode 'db=public' \
  --data-urlencode 'query=avg(system_metrics{idc="idc_a"})' \
  --data-urlencode 'start=1667446797' \
  --data-urlencode 'end=1667446799' \
  --data-urlencode 'step=1s' \
  http://localhost:4000/v1/promql
Table Creation
Before diving in, it's essential to download GreptimeDB. For a comprehensive step-by-step guide, kindly visit the Dashboard repo on GitHub. Once you've downloaded and launched GreptimeDB, you can initiate table creation by following the instructions at http://localhost:4000/dashboard/playground page.
Alternatively, consider exploring our cloud service, which is currently under time-limited free tech preview at https://console.greptime.cloud/.
For table creation, we use SQL and below is a succinct reference:
shell
CREATE TABLE IF NOT EXISTS cpu_metrics (
    hostname STRING,
    environment STRING,
    usage_user DOUBLE,
    usage_system DOUBLE,
    usage_idle DOUBLE,
    ts TIMESTAMP DEFAULT CURRENT_TIMESTAMP TIME INDEX,
    PRIMARY KEY(hostname, environment)
);
The PRIMARY KEY here corresponds to the concept of Tag Columns in the table model, which will be elaborated later.
Similarly, we can insert a few records using SQL:
shell
INSERT INTO cpu_metrics
VALUES
    ('host_0','test',32,58,36,1680307200),
    ('host_1','test',29,65,20,1680307200),
    ('host_1','staging',12,32,50,1680307200),
    ('host_2','staging',67,15,42,1680307200);
Table Model
GreptimeDB's table model is based on relational databases while incorporating the unique attributes of time-series data. Notably, it introduces a Timestamp (ts) column and designates this ts column as the primary time index for each table.
In GreptimeDB, every piece of data is systematically structured into tables, which are made up of four components: the Table Name (Metrics), Tag Columns, Field Columns, and Timestamp.
A crucial aspect to highlight is that GreptimeDB treats all the Tag Columns as the Primary Key.
For more details on the table model, refer to the GreptimeDB documentation.
Dashboard
The picture below shows a simple implementation of range_query in GreptimeDB:
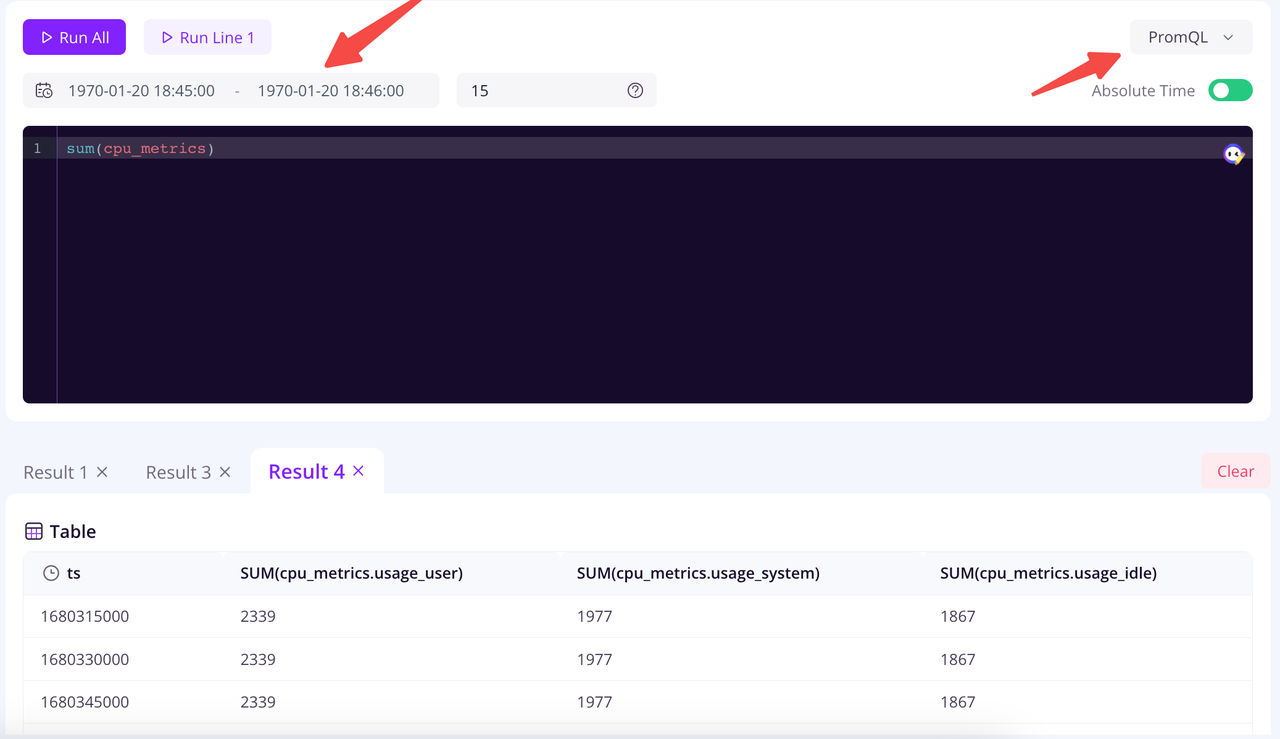
You can seamlessly select the time range and set the 'Step' value via the interactive interface, which correlates to the 'start', 'end', and 'step' parameters. You can simply choose a recent time or select a time period.
The parameter "db" will be automatically included, with its value being the current dashboard's db value and there's no need to pay excessive attention to it.
The only thing users need to focus on is the query itself.
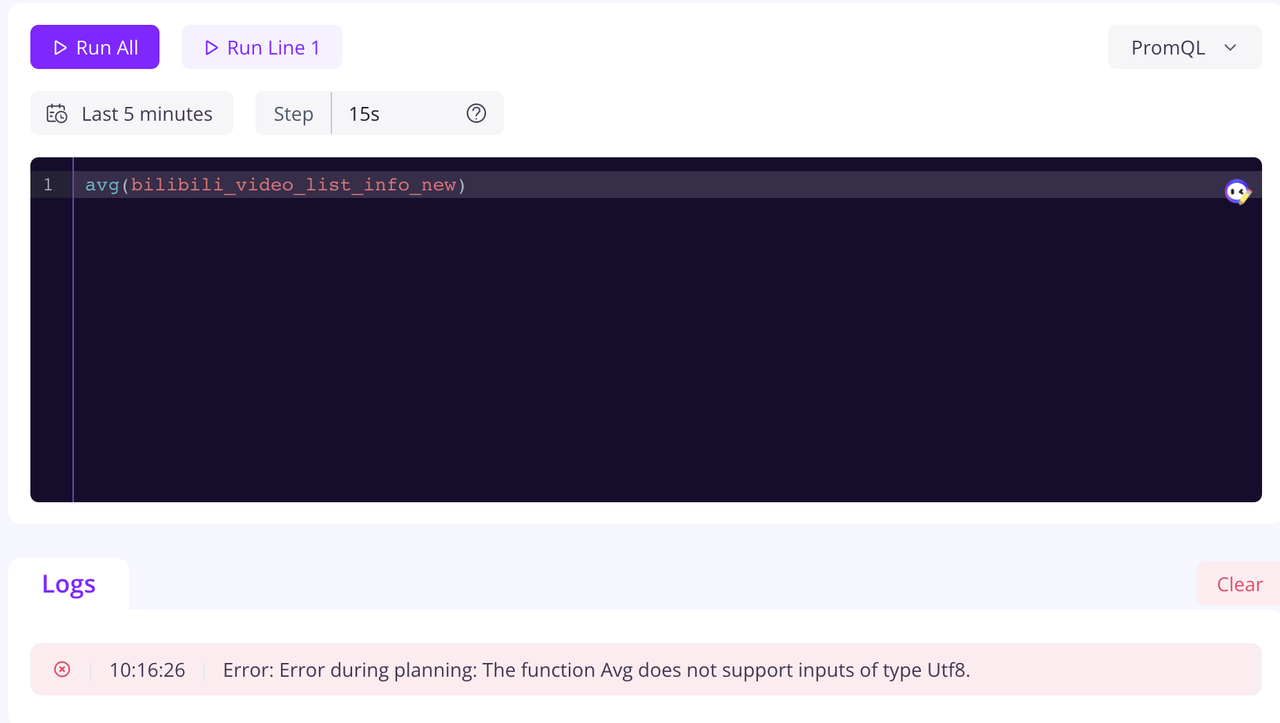
It's important to note that when a non-Double type appears in the metric's value, PromQL's calculation functions will be unavailable.
To illustrate:
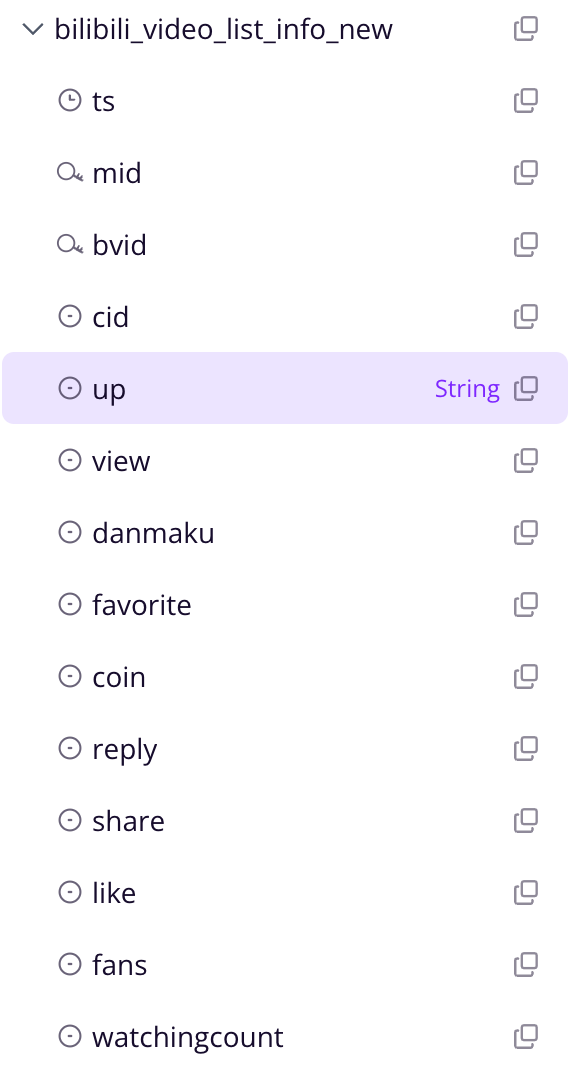
Since up here is a String type value. When we perform calculations on the bilibili_video_list_info_new metric, an error will occur, as shown in the figure below:
Why would a String type value appear in the metric? The reason is that in GreptimeDB, we need to use SQL statements to create tables. At this juncture, non-Double type values are permissible (here, the concept of a table can be roughly equated to a metric).
If you wish to use PromQL queries more effectively in GreptimeDB, it's recommended not to specify the 'value' as any type other than 'Double'.
greptime-js-sdk
If you want to use GreptimeDB in your Node.js project or website, you can use our JS-SDK.
URL: https://github.com/GreptimeTeam/greptime-js-sdk
Installation:
shell
npm i greptimeBasic usage:
javascript
// use in your project
import greptime from 'greptime'

const { sql, promql} = greptime({
    host: 'your_host',
    dbname: 'your_dbname',
    username: 'your_username',
    password: 'your_password'
})

// if you download the greptime and run it locally, you can use {} as the parameter ⬇️
const { sql, promql} = greptime({})

// to use promql ⬇️
const resOfDuration = await promql.query('your_metrics')
    .duration('5m')
    .step('1s')
    .run()

// or select time bucket ⬇️
const res = await promql.query('your_metrics')
    .start('start_time')
    .end('end_time')
    .step('1s')
    .run()
First, we call the greptime() function, taking { host, dbname, username, password } as parameters.
You can create a service in GreptimeCloud to obtain the above parameters (the service refers to the cloud database).
Alternatively, you can download the Greptime database from the GreptimeDB Download page and run it locally (as the Dashboard mentioned). In this case, you can pass { } as parameters.
The greptime() function returns two instances, SQL and PromQL. The SQL instance encompasses operations like creating tables, adding, deleting, querying, etc., which we won't delve into here.
Let's focus on the PromQL instance instead. PromQL has implemented a chain call method, making it more convenient for developers to use and understand. Below is an explanation of PromQL-related functions:
PromQL Function Descriptions
query: Essential. Input either a metric name or a PromQL function likesum(),avg(), and so on. It's of String type. For example:query('avg(your_metrics)').start, end: These are optional. You may opt for these or thedurationmentioned below. Both the start and end times must be defined together, accepting a timestamp of numeric type.duration: This is also optional. It asks for a time span in String type, such asduration('10m'). If left unspecified, it defaults to '5m', capturing the period from 5 minutes ago to the present. Without setting eitherdurationor the(start, end)functions, it naturally assumesduration('5m').step: Optional. Provide a query interval in String type, likestep('10s'). In the absence of a designated interval, it defaults to '1s'.run: This is mandatory. Without parameters, its sole purpose is to initiate the PromQL query.
Attention: As with the Dashboard, when metrics have values that aren't of the 'Double' type, PromQL functions cannot be passed into the query() for queries.
For example, query('avg(your_metrics)') is not permissible. Instead, utilize query('your_metrics') is fine.
Conclusion
In order to better explore the value of time-series data, PromQL is a language worth learning as it has significant advantages in querying and secondary calculations of time-series data.
Combined with our Dashboard and SDK, it offers users convenience in querying, helping them discover the intrinsic value of time-series data.
To accommodate developers across diverse programming backgrounds, we're advancing SDKs in multiple languages and enhancing visualization tools. We're also committed to refining PromQL compatibility in upcoming versions and honing our toolkit, all with an ambition to deliver genuine value to our users.
Further Reading on PromQL
If you're just starting with PromQL and are keen to delve deeper, we've previously posted a couple of articles that might serve as useful references:
Deep Dive into PromQL and How GreptimeDB Implements the Parser
PromQL for Beginner - a brief analysis of the history and features of PromQL


