On this page

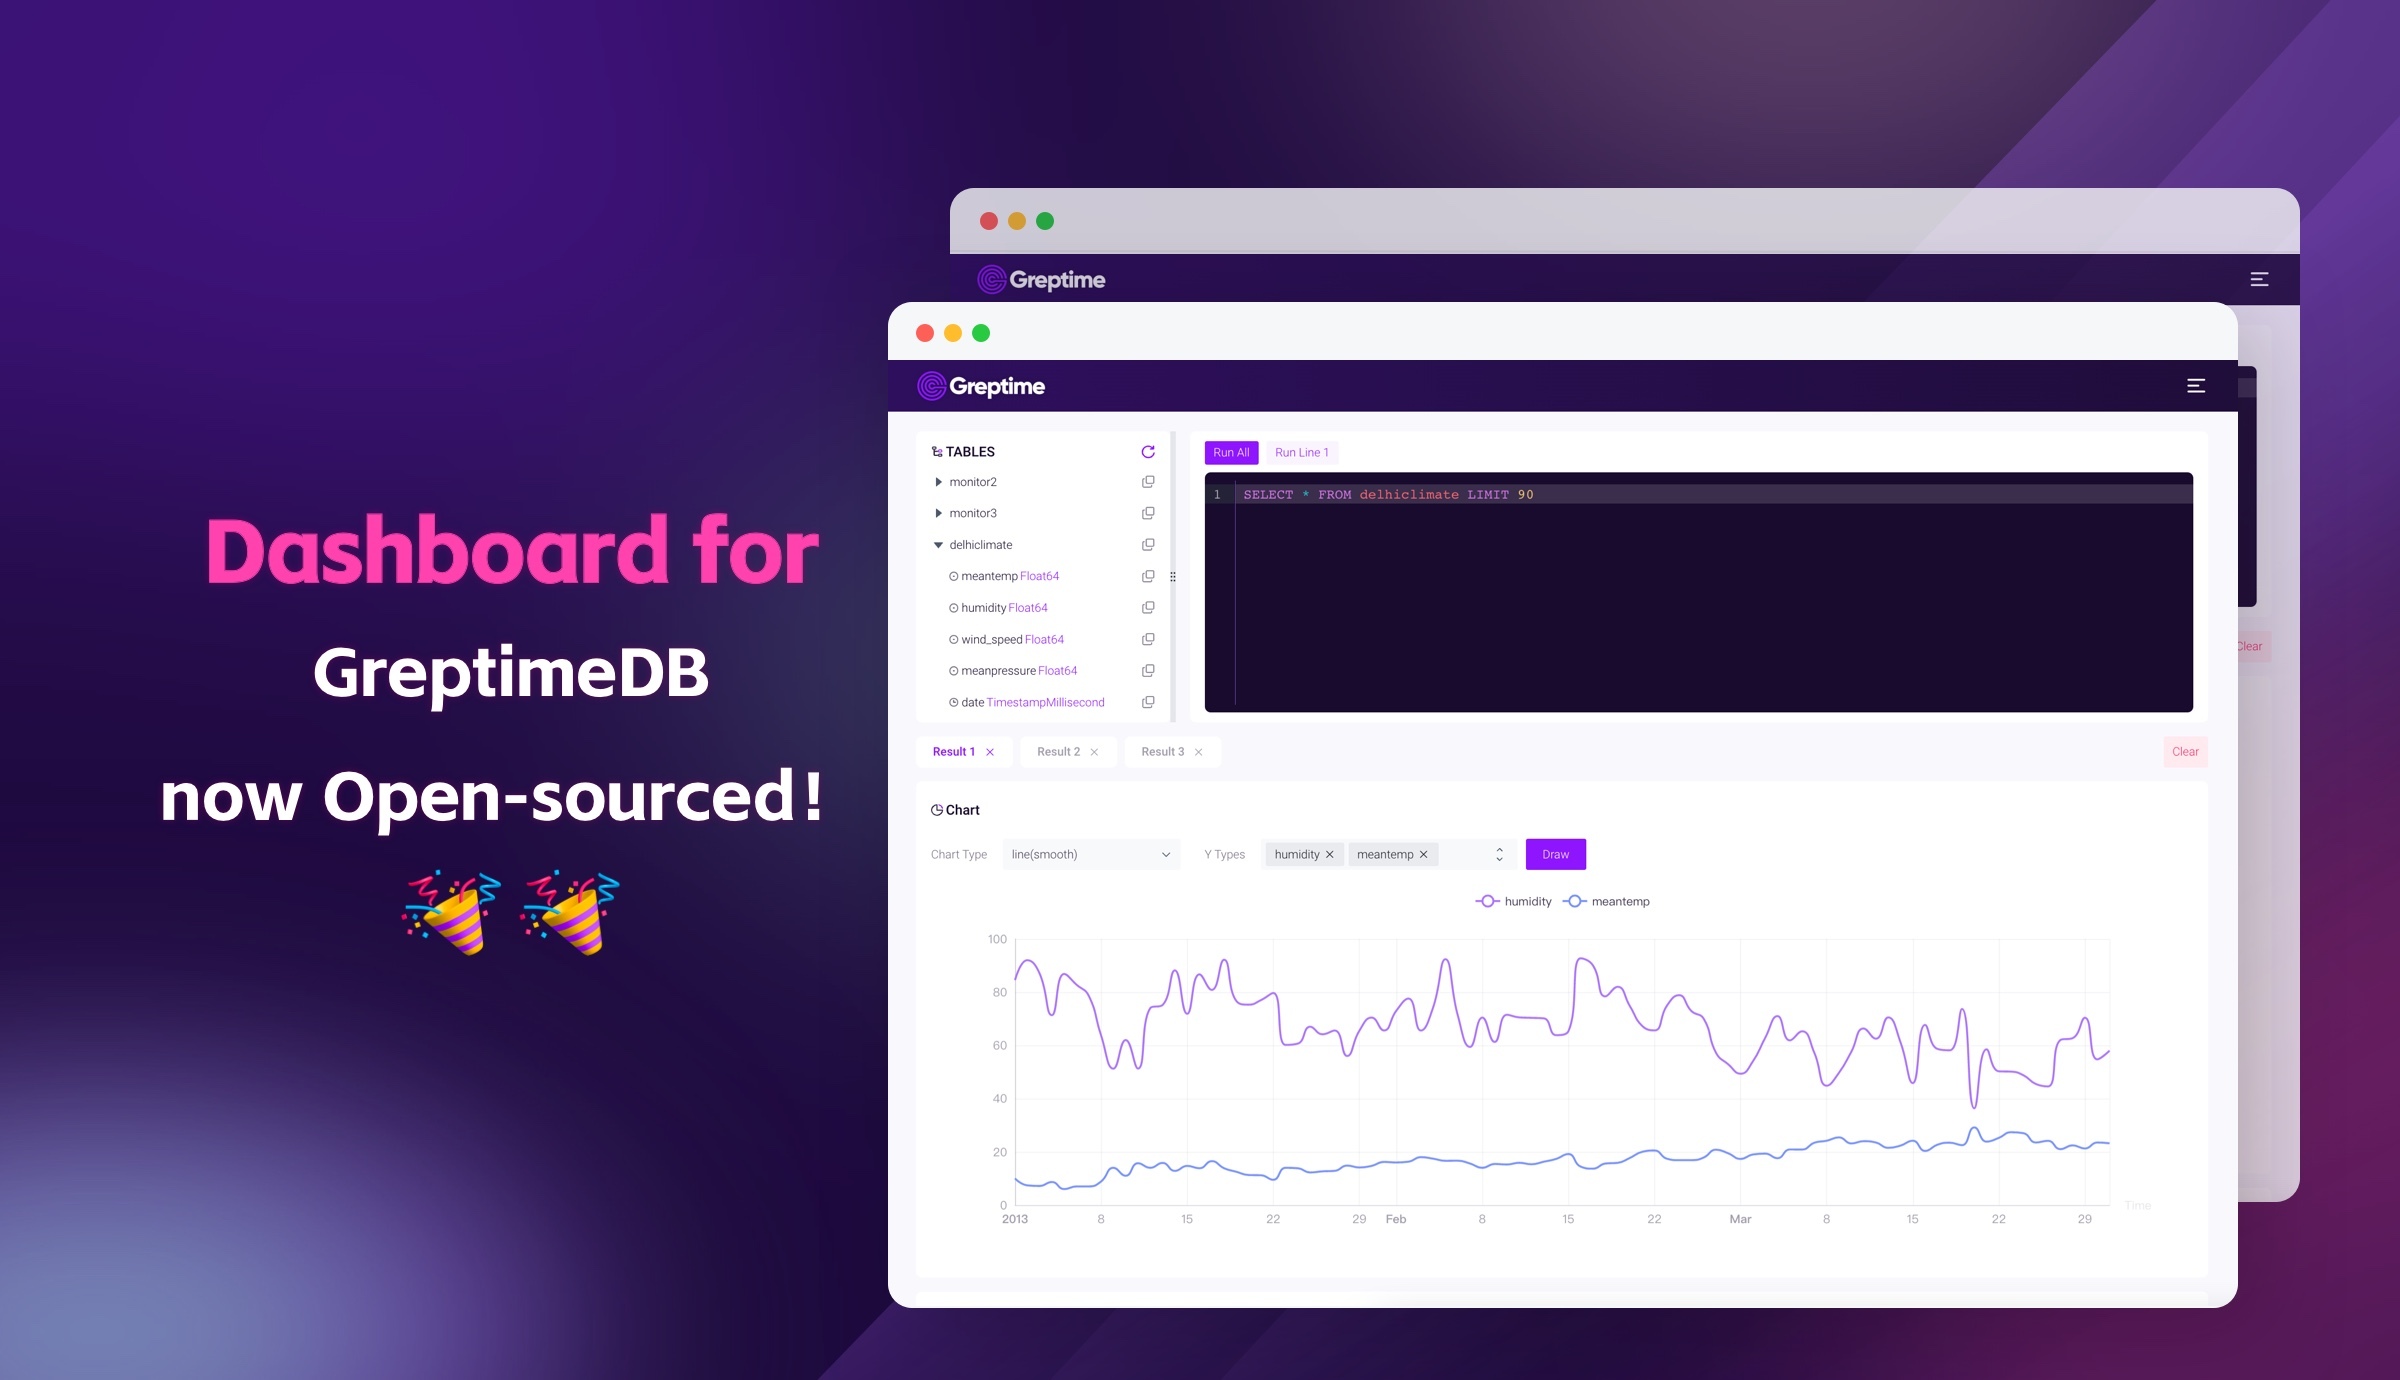
After the open-sourcing of our time series database, GreptimeDB, our Dashboard quickly followed up to be open-sourced as well. You can check it out here on GitHub now.
What Is A Time Series Database
For some readers who have not heard of GreptimeDB, let's introduce what a time series database is first.
Most people with a tech background are familiar with databases. We have MySQL for common relational databases, Redis for key-value pair storage databases, geographic information databases and graph relation databases. The different storage strategies are determined by different scenarios in which the data is applied and, essentially, by the various data models they serve.
When it comes to selecting the right type of database, it's determined by factors such as data volume, frequency of CRUD operations, and requirements for data querying methods. Traditional relational databases are a relatively balanced solution in all aspects. However, for time series data, there is a large amount of writes with almost no deletions or updates, and the data volume is enormous. Also, real-time data processing and historical data analysis are both required. With these characteristics, traditional databases are not capable of dealing with time series data.
A typical real-life case for the usage of a time series database is to record the enormous data generated from sensors installed on machines in a factory. We can display the real-time operation status on a large screen, conduct refined analysis using accumulated historical data, and the monitoring scripts alarm if the data goes abnormal.
For databases, guaranteeing high-performance and reliable reads/writes is the most basic requirement, above all, how to use data to generate value is more of a concern.
Why Design the Dashboard for GreptimeDB
With the rapid development of intelligent vehicles and IoT devices in recent years, collecting time series data is the first and most fundamental step before performing advanced analytical tasks, there is still plenty of room for exploration on how to present and use the time series data collected. Though businesses may have in-house data warehouses or use other terminals to visualize the data, for a considerable number of database users, developing an easy-to-use front-end interface may still be challenging. As mentioned in Databases in 2022: A Year in Review by Andy Pavlo, a database professor at CMU, "..., the critical differentiator between DBMS offerings will be things that are difficult to quantify, like UI/UX stuff and query optimization." Therefore, as database developers, we need to provide an out-of-the-box console to let users get the total value out of the data.
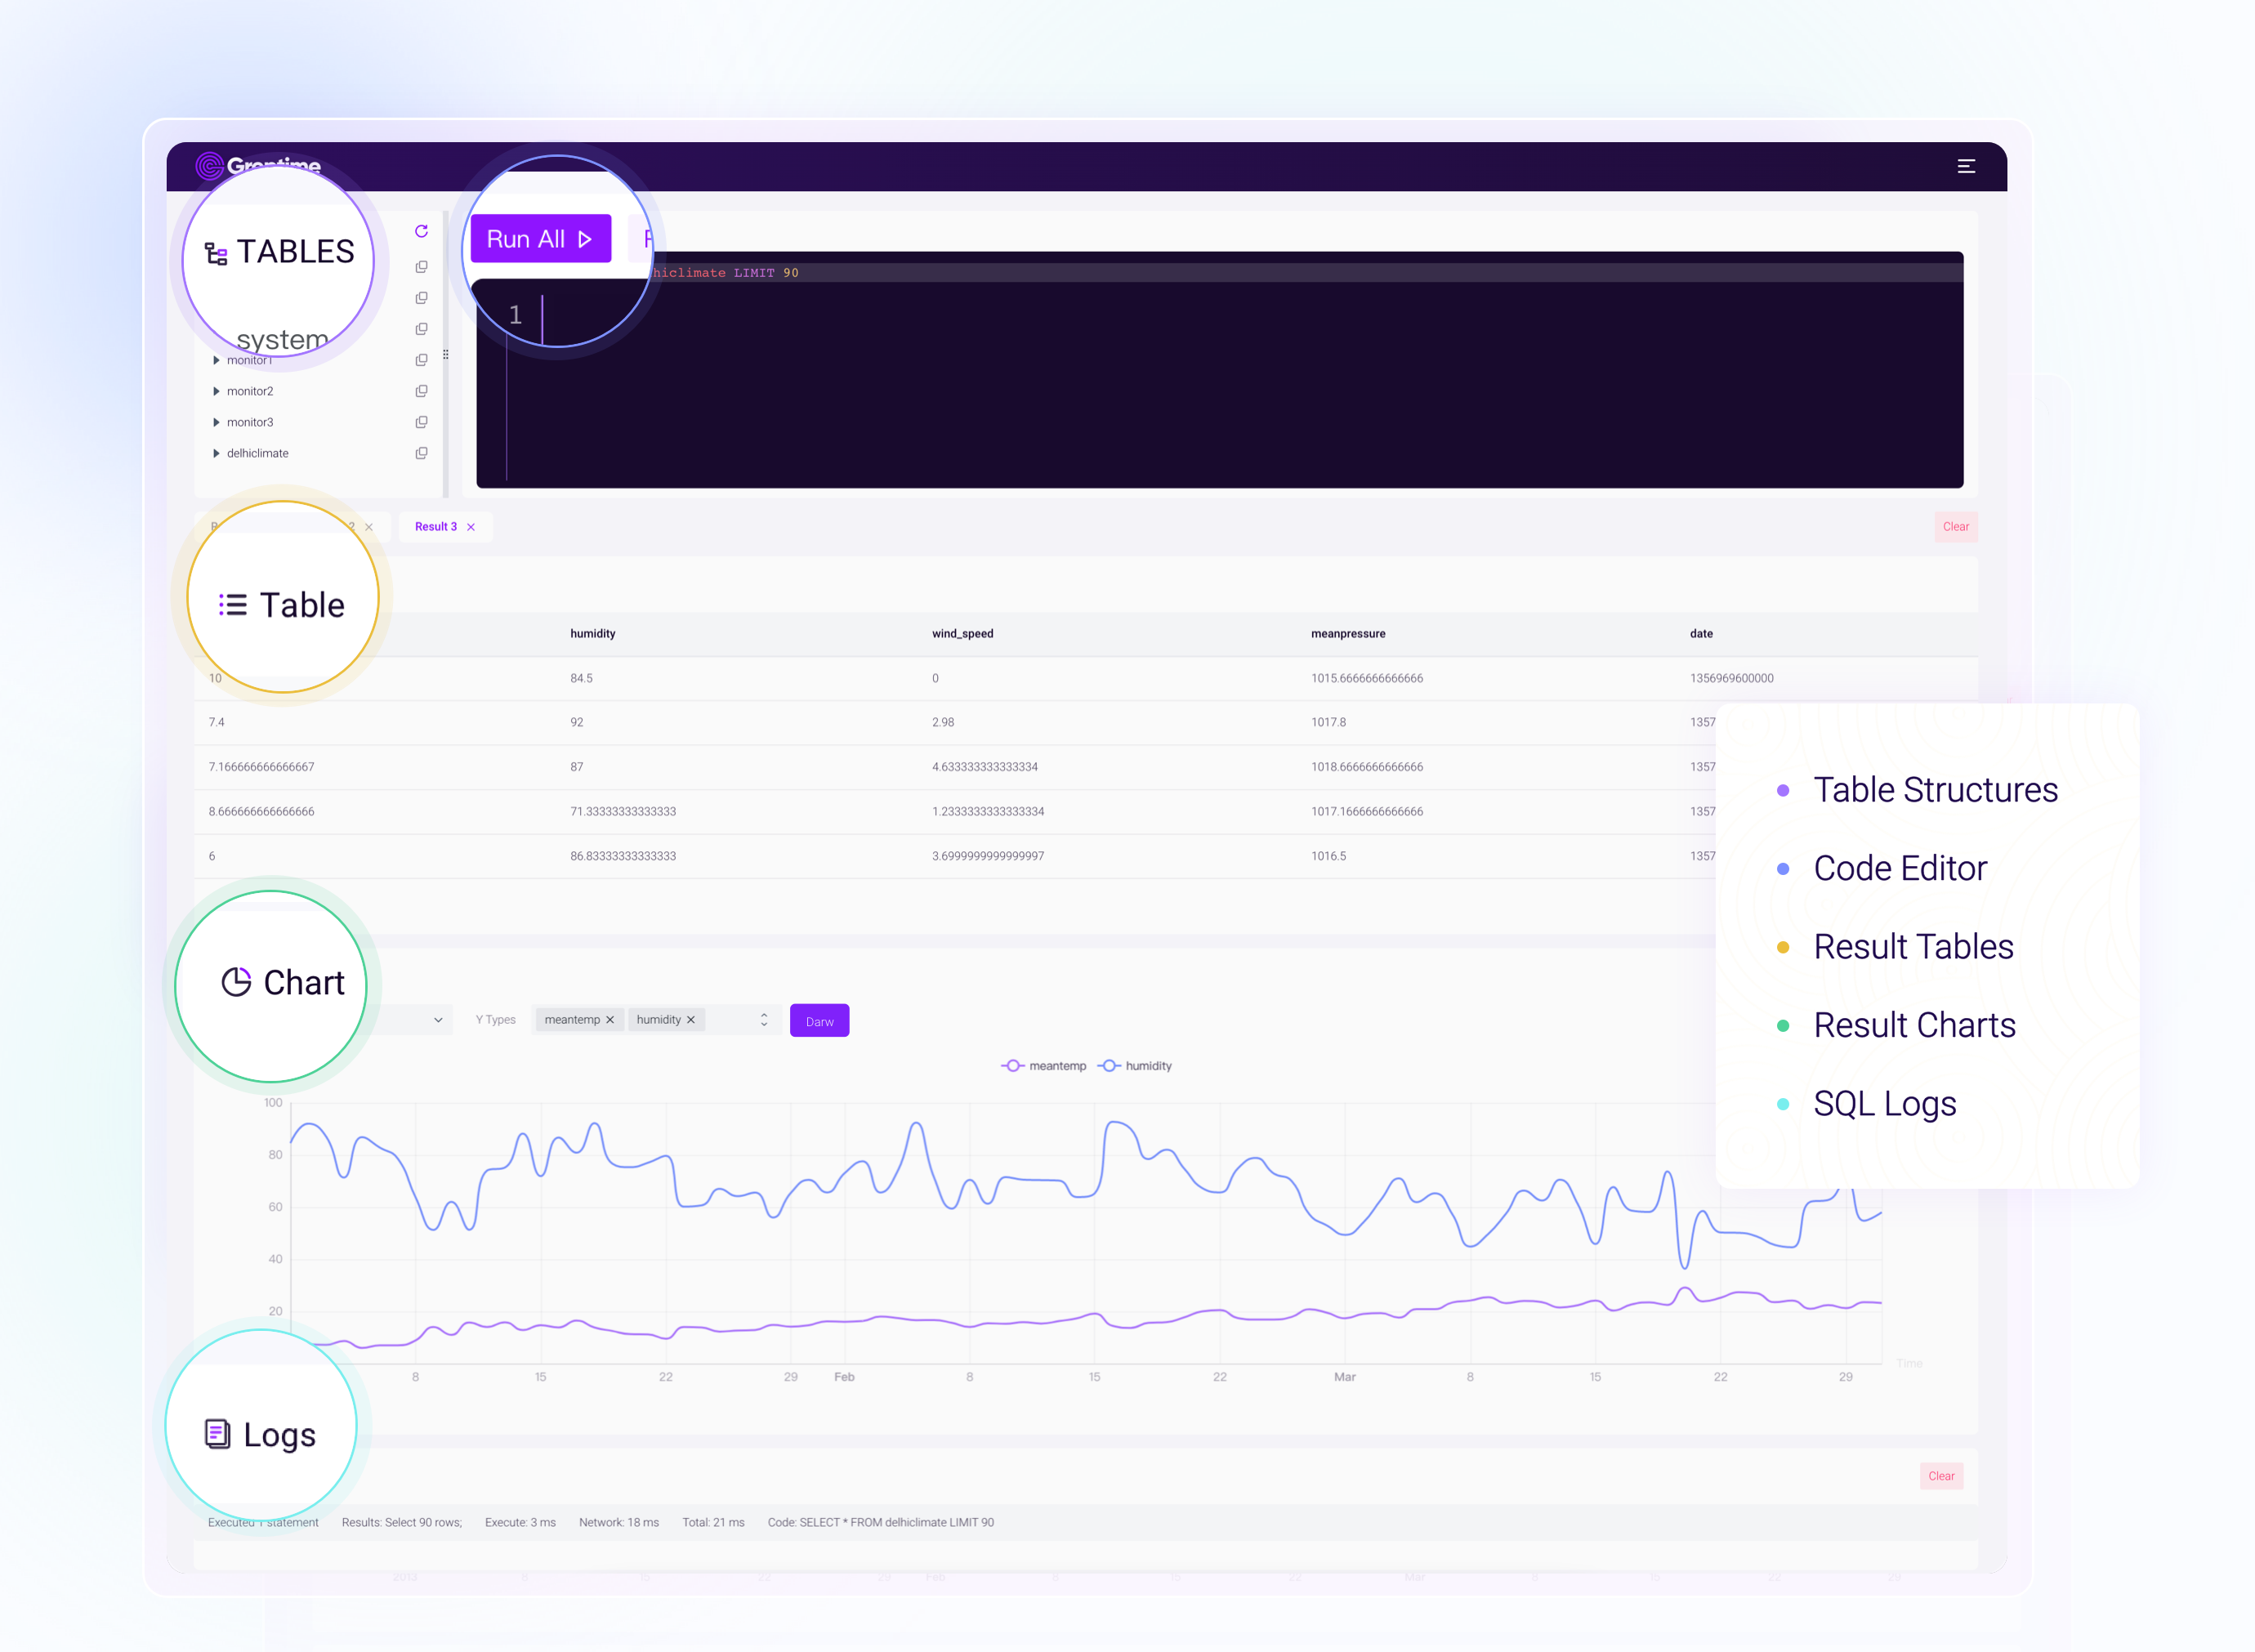
Our first open-sourced version enables showing table structure and supports basic SQL statements for queries. The query results will be displayed in the form of tables and graphs. We support line graphs, histograms, scatter graphs and point maps for different data types. Meanwhile, the request log will also be displayed, including the request time.
For future iterations, the dashboard will support Python scripts to provide more data query methods and enable typical script collection and quick insertion functions to enhance user experiences.
GreptimeCloud, our SaaS product, will also integrate with the dashboard, and with the iteration of our products and services, new features will also be synchronized into the open-source version.
How the Dashboard Pivot to the Future
Now that we have supported basic data queries on our Dashboard, in the future, there are several potential iteration directions.
First, our Dashboard will continue to support new features of GreptimeDB. For example, after multi-line SQL queries were supported on the interface, our Dashboard also synchronized this feature immediately. As an official project, the Dashboard should be the best practice of GreptimeDB. (Of course, we also hope that with collective intelligence, better use cases will appear from our community.) The explicit goal is that users can experience the latest features of GreptimeDB through the Dashboard.
Second, we are determined to make continuous improvement on the UI of the dashboard Our goal is to keep providing a smooth experience when users interact with our products.
For the front end, it's not technically challenging to build a dashboard because there exist various mature libraries to support our tasks, such as building component libraries and charts. Nevertheless, building a user-friendly and ready-to-use dashboard requires us to have a deep understanding of challenges faced by enterprises when handling time series data, as well as the ability to provide practical solutions under different real life scenarios. This is an appealing challenge for our developers, and as all walks of life pay more attention to time series data, how to use time series databases to support and resolve business pain points will become a big focus in the near future.
As various use cases for time series data appear in real life, like real-time display, monitoring and alarming, and historical data analysis, we would like to offer an easy-to-use solution. We designed this dashboard after having numerous workshops with users from different industries and collecting their business problems, we hope our solution can be a go-to tool to use when users are interacting with GreptimeDB or even other time series databases.
As an open-source project under continuous development, in addition to supporting python as mentioned above, other issues such as the notebook function will also be an enhancement. We would warmly welcome any comments or insights from the community. If you have any thoughts or suggestions on our Dashboard, join GreptimeDB Community on Slack to share your ideas with us, and if possible, raise issues and PRs to make the Dashboard better together!


