Step 1 Download GreptimeDB
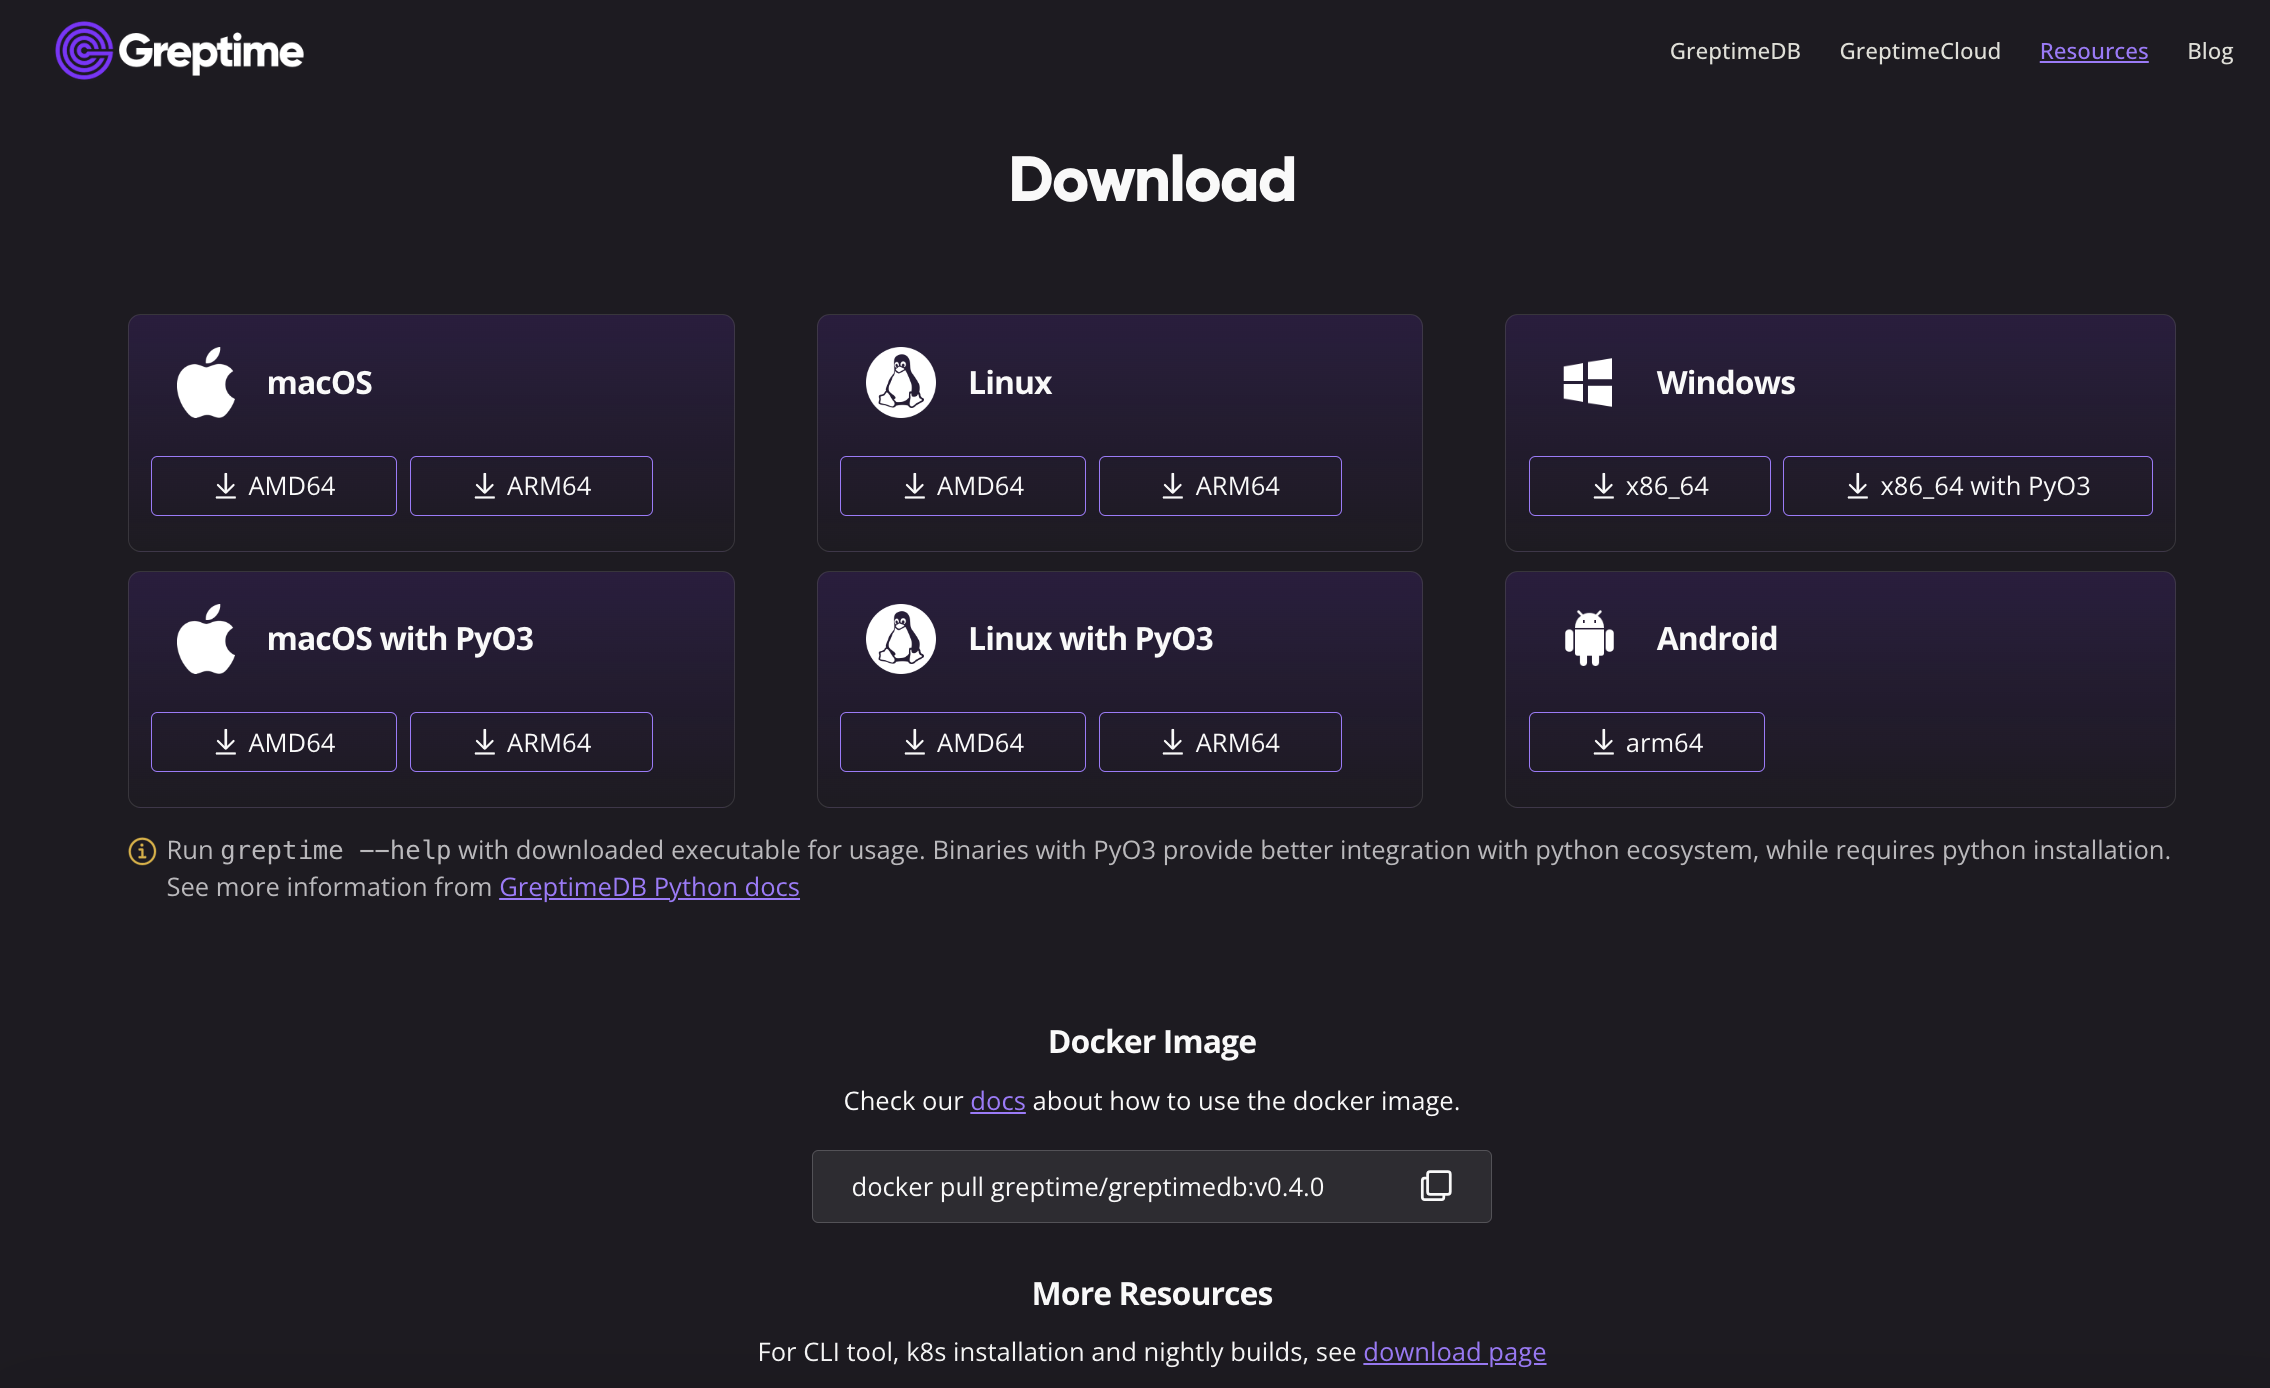
To begin, download the GreptimeDB binary file for your platform. Visit the Greptime resources page to access the packaged binary files. For those leveraging containerized environments, there's also a Docker image ready for use.

Please refer to the Installation Guide for more installation methods.
In this tutorial, we will demonstrate using the installation script we provide. Open your terminal and navigate to a temporary working directory. Executing the following script will automatically download and install GreptimeDB on your local machine.
curl -fsSL \
  https://raw.githubusercontent.com/greptimeteam/greptimedb/develop/scripts/install.sh | sh
Here, we use the nightly build version for demonstration, which is only intended for testing purposes. For stable production use, please download the latest official release version (as of the time this article was written, it's v0.4.0).
If everything goes smoothly, you should be able to see an output similar to the following:
x greptime-darwin-arm64-v0.4.0-nightly-20231002/
x greptime-darwin-arm64-v0.4.0-nightly-20231002/greptime
Run './greptime --help' to get started
You should be able to see the greptime binary file in the current directory:
-rwxr-xr-x 1 dennis staff 134M Oct 2 10:08 greptimeExecute the ./greptime --help command to view the guide info:
greptimedb
branch: develop
commit: 201acd152db2a961d804b367e23d2224b4397de8
dirty: false
version: 0.4.0-nightly

USAGE:
    greptime [OPTIONS] <SUBCOMMAND>

OPTIONS:
    -h, --help                     Print help information
        --log-dir <LOG_DIR>
        --log-level <LOG_LEVEL>
    -V, --version                  Print version information

SUBCOMMANDS:
    cli
    datanode
    frontend
    help          Print this message or the help of the given subcommand(s)
    metasrv
    standalone
Step 2: Configure the S3 information
Assuming that you've already created an S3 bucket and have the corresponding Access Key ID/Secret and other authentication information, now let's proceed to the configuration process.
First, you can download the sample configuration file for standalone mode,standalone.example.toml, from our GitHub repository. Let's assume we save it as config.toml:
curl https://raw.githubusercontent.com/GreptimeTeam/greptimedb/develop/config/standalone.example.toml > config.tomlNext, edit the config.toml file. The critical section to focus on is the [storage] segment, for which you can view a sample file here:
[storage]
# The working home directory.
data_home = "/tmp/greptimedb/"
# Storage type.
type = "File"
# TTL for all tables. Disabled by default.
# global_ttl = "7d"
# Cache configuration for object storage such as 'S3' etc.
# cache_path = "/path/local_cache"
# The local file cache capacity in bytes.
# cache_capacity = "256Mib"
The above configuration is set for local disk mode, with the database root directory specified as /tmp/greptimedb/.
Referring to the configuration documentation, let's modify it to store the data on AWS S3:
[storage]
# The working home directory.
data_home = "/tmp/greptimedb/"
# Storage type.
type = "S3"
bucket = "greptimedb-test"
root = "/s3test"
region = "ap-southeast-1"
access_key_id = "***********"
secret_access_key = "*********************"
# endpoint = ""
You need to replace some key parameters with your S3 bucket details, specifically:
bucket: The name of the bucket you created.root: The directory of the database data. Here, it's set to/s3test, starting from the root directory of the bucket.access_key_id: The Access Key ID for S3 access.secret_access_key: The Secret Access Key for S3 access.- If necessary, modify the
regionorendpoint.
Step 3: Launch and test
Once configured correctly, you can proceed with testing. Run the following command to start the standalone version of GreptimeDB:
./greptime standalone start -c config.tomlWe specified the configuration file using the -c option. If it starts up correctly, you should see logs similar to the following at the end:
2023-10-11T07:33:34.832355Z  INFO frontend::server: Starting HTTP_SERVER at 127.0.0.1:4000
2023-10-11T07:33:34.855511Z  INFO servers::http: Enable dashboard service at '/dashboard'
2023-10-11T07:33:34.856408Z  INFO servers::http: HTTP server is bound to 127.0.0.1:4000
2023-10-11T07:33:34.856742Z  INFO frontend::server: Starting GRPC_SERVER at 127.0.0.1:4001
2023-10-11T07:33:34.857168Z  INFO servers::grpc: gRPC server is bound to 127.0.0.1:4001
2023-10-11T07:33:34.859433Z  INFO frontend::server: Starting MYSQL_SERVER at 127.0.0.1:4002
2023-10-11T07:33:34.859453Z  INFO servers::server: MySQL server started at 127.0.0.1:4002
2023-10-11T07:33:34.859465Z  INFO frontend::server: Starting OPENTSDB_SERVER at 127.0.0.1:4242
2023-10-11T07:33:34.859485Z  INFO servers::server: OpenTSDB server started at 127.0.0.1:4242
2023-10-11T07:33:34.859490Z  INFO frontend::server: Starting POSTGRES_SERVER at 127.0.0.1:4003
2023-10-11T07:33:34.859500Z  INFO servers::server: Postgres server started at 127.0.0.1:4003
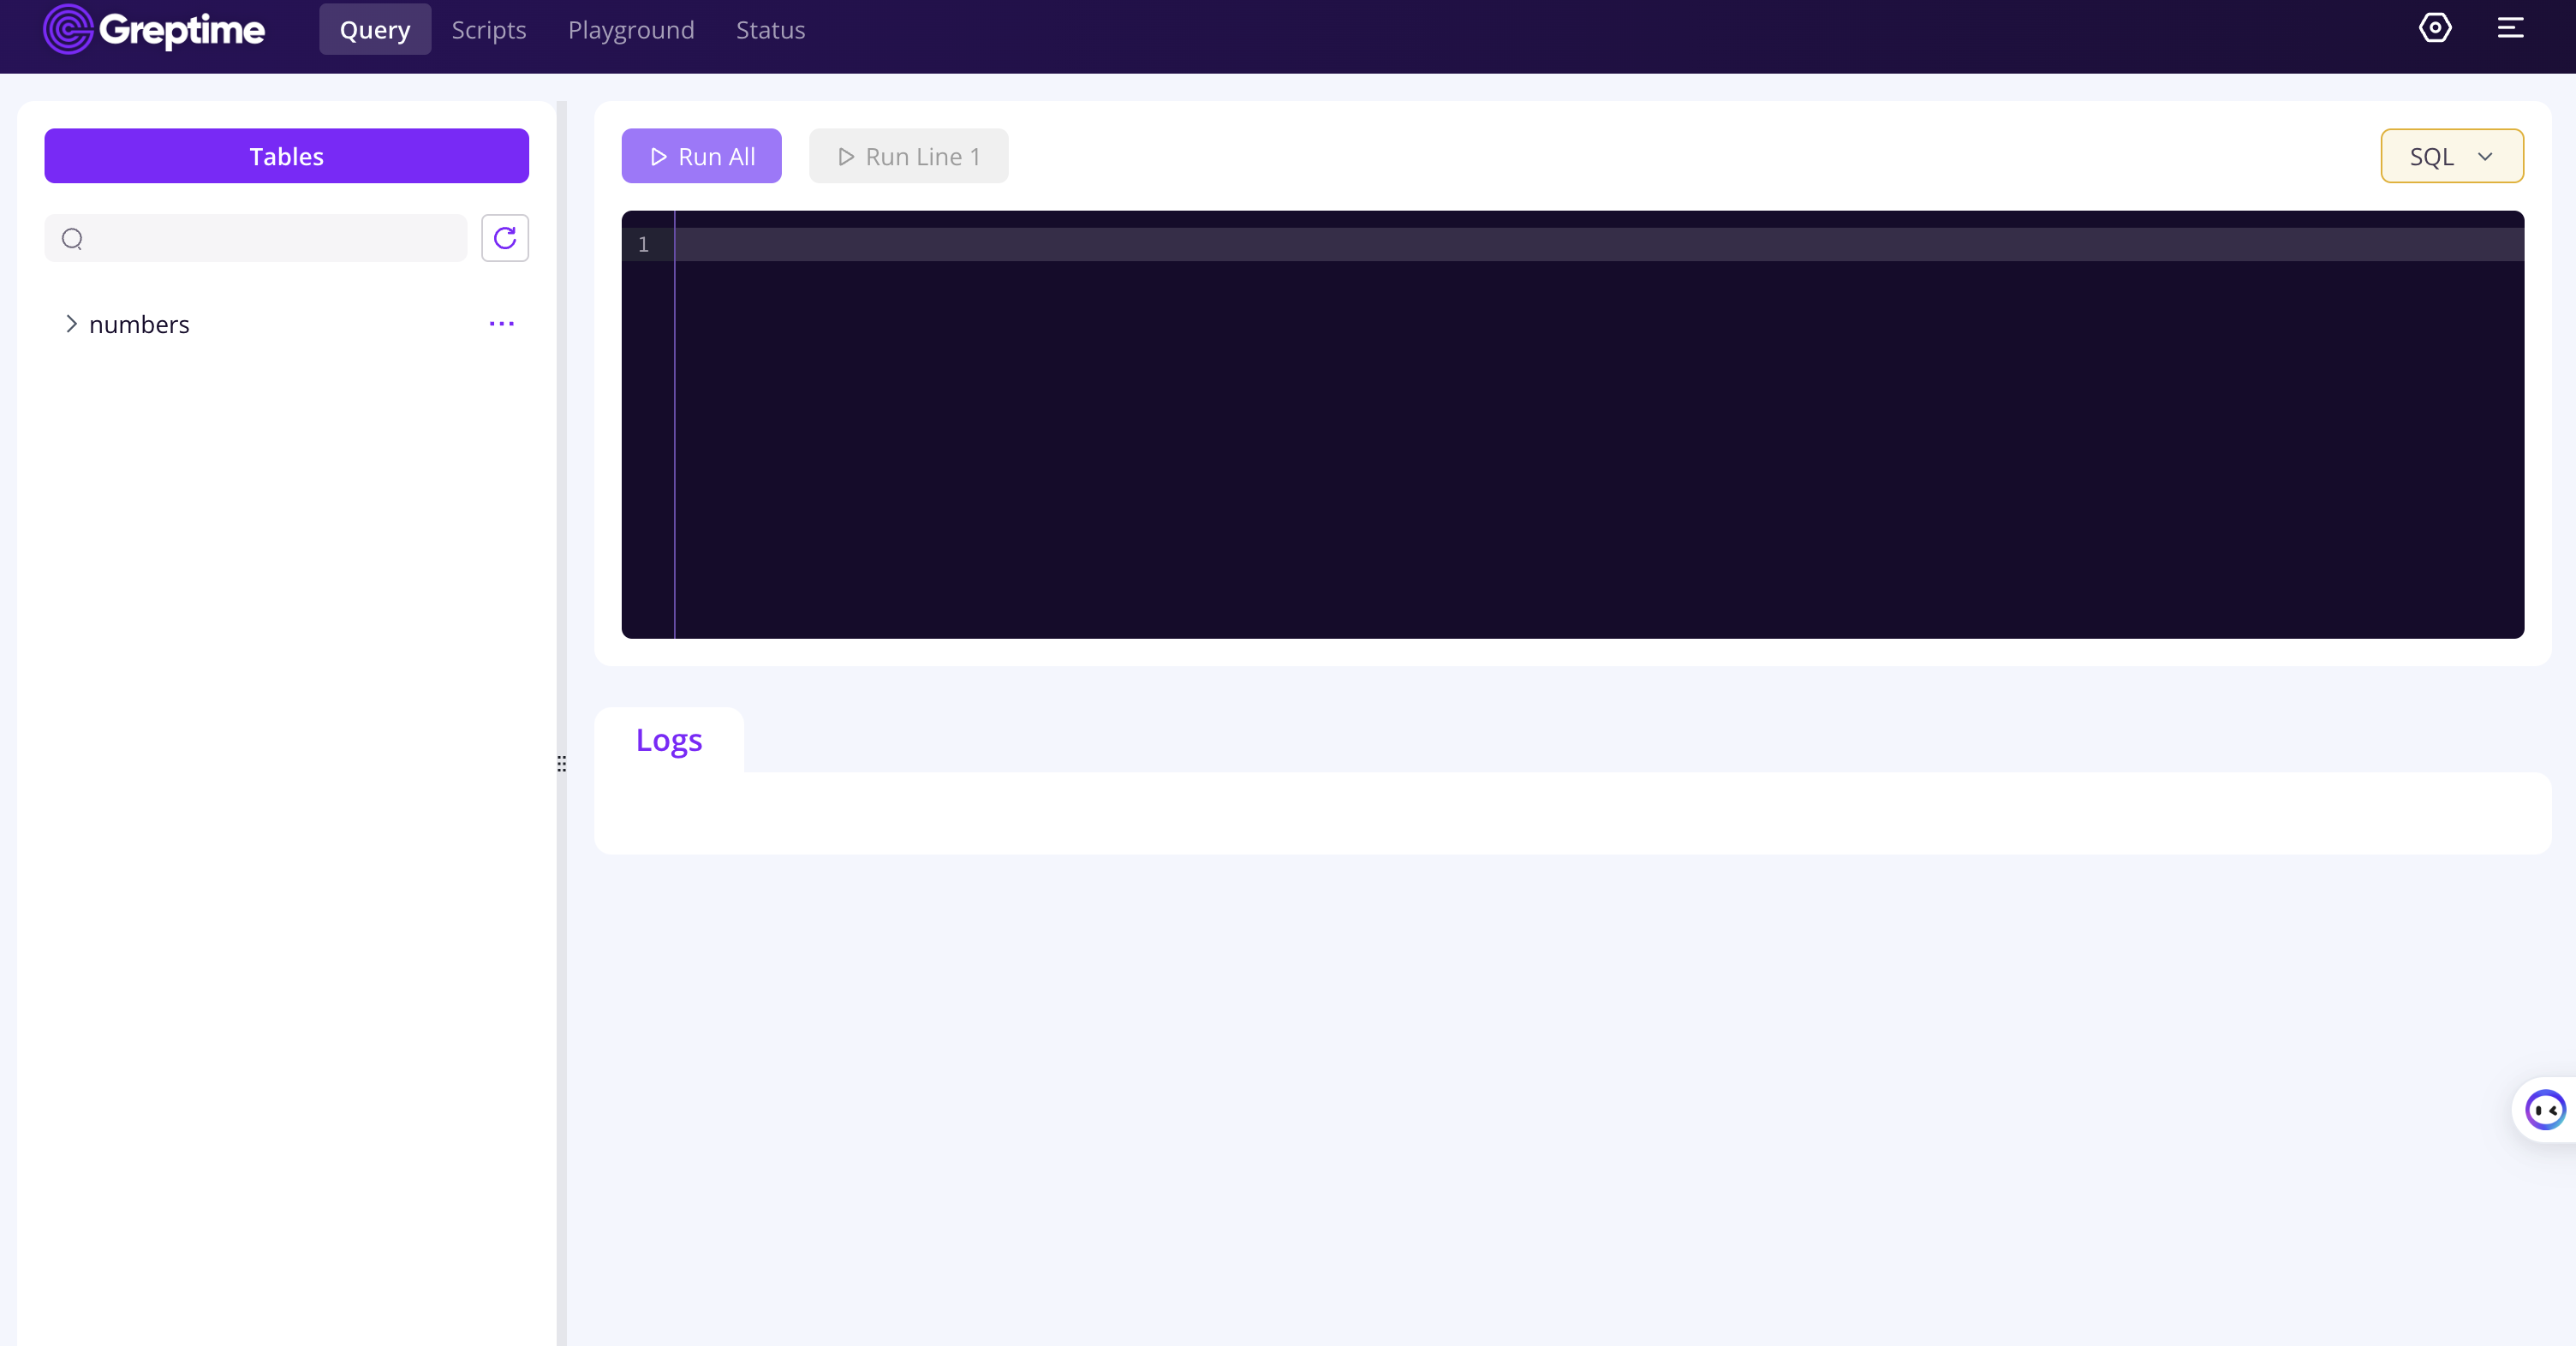
GreptimeDB will bind and listen to various protocol ports it supports. You can access the built-in GreptimeDB Dashboard by navigating to the following URL in your browser: http://localhost:4000/dashboard/.

Here, you can execute SQL, Python, PromQL, and other query languages.
Next, let's try to create tables, insert data, and make queries. You can execute these SQL commands directly within the dashboard window:
CREATE TABLE IF NOT EXISTS system_metrics (
    host STRING,
    idc STRING,
    cpu_util DOUBLE,
    memory_util DOUBLE,
    disk_util DOUBLE,
    ts TIMESTAMP DEFAULT CURRENT_TIMESTAMP,
    PRIMARY KEY(host, idc),
    TIME INDEX(ts)
);

INSERT INTO system_metrics
VALUES
    ("host1", "idc_a", 11.8, 10.3, 10.3, 1667446797450),
    ("host1", "idc_a", 80.1, 70.3, 90.0, 1667446797550),
    ("host1", "idc_b", 50.0, 66.7, 40.6, 1667446797650),
    ("host1", "idc_b", 51.0, 66.5, 39.6, 1667446797750),
    ("host1", "idc_b", 52.0, 66.9, 70.6, 1667446797850),
    ("host1", "idc_b", 53.0, 63.0, 50.6, 1667446797950),
    ("host1", "idc_b", 78.0, 66.7, 20.6, 1667446798050),
    ("host1", "idc_b", 68.0, 63.9, 50.6, 1667446798150),
    ("host1", "idc_b", 90.0, 39.9, 60.6, 1667446798250);

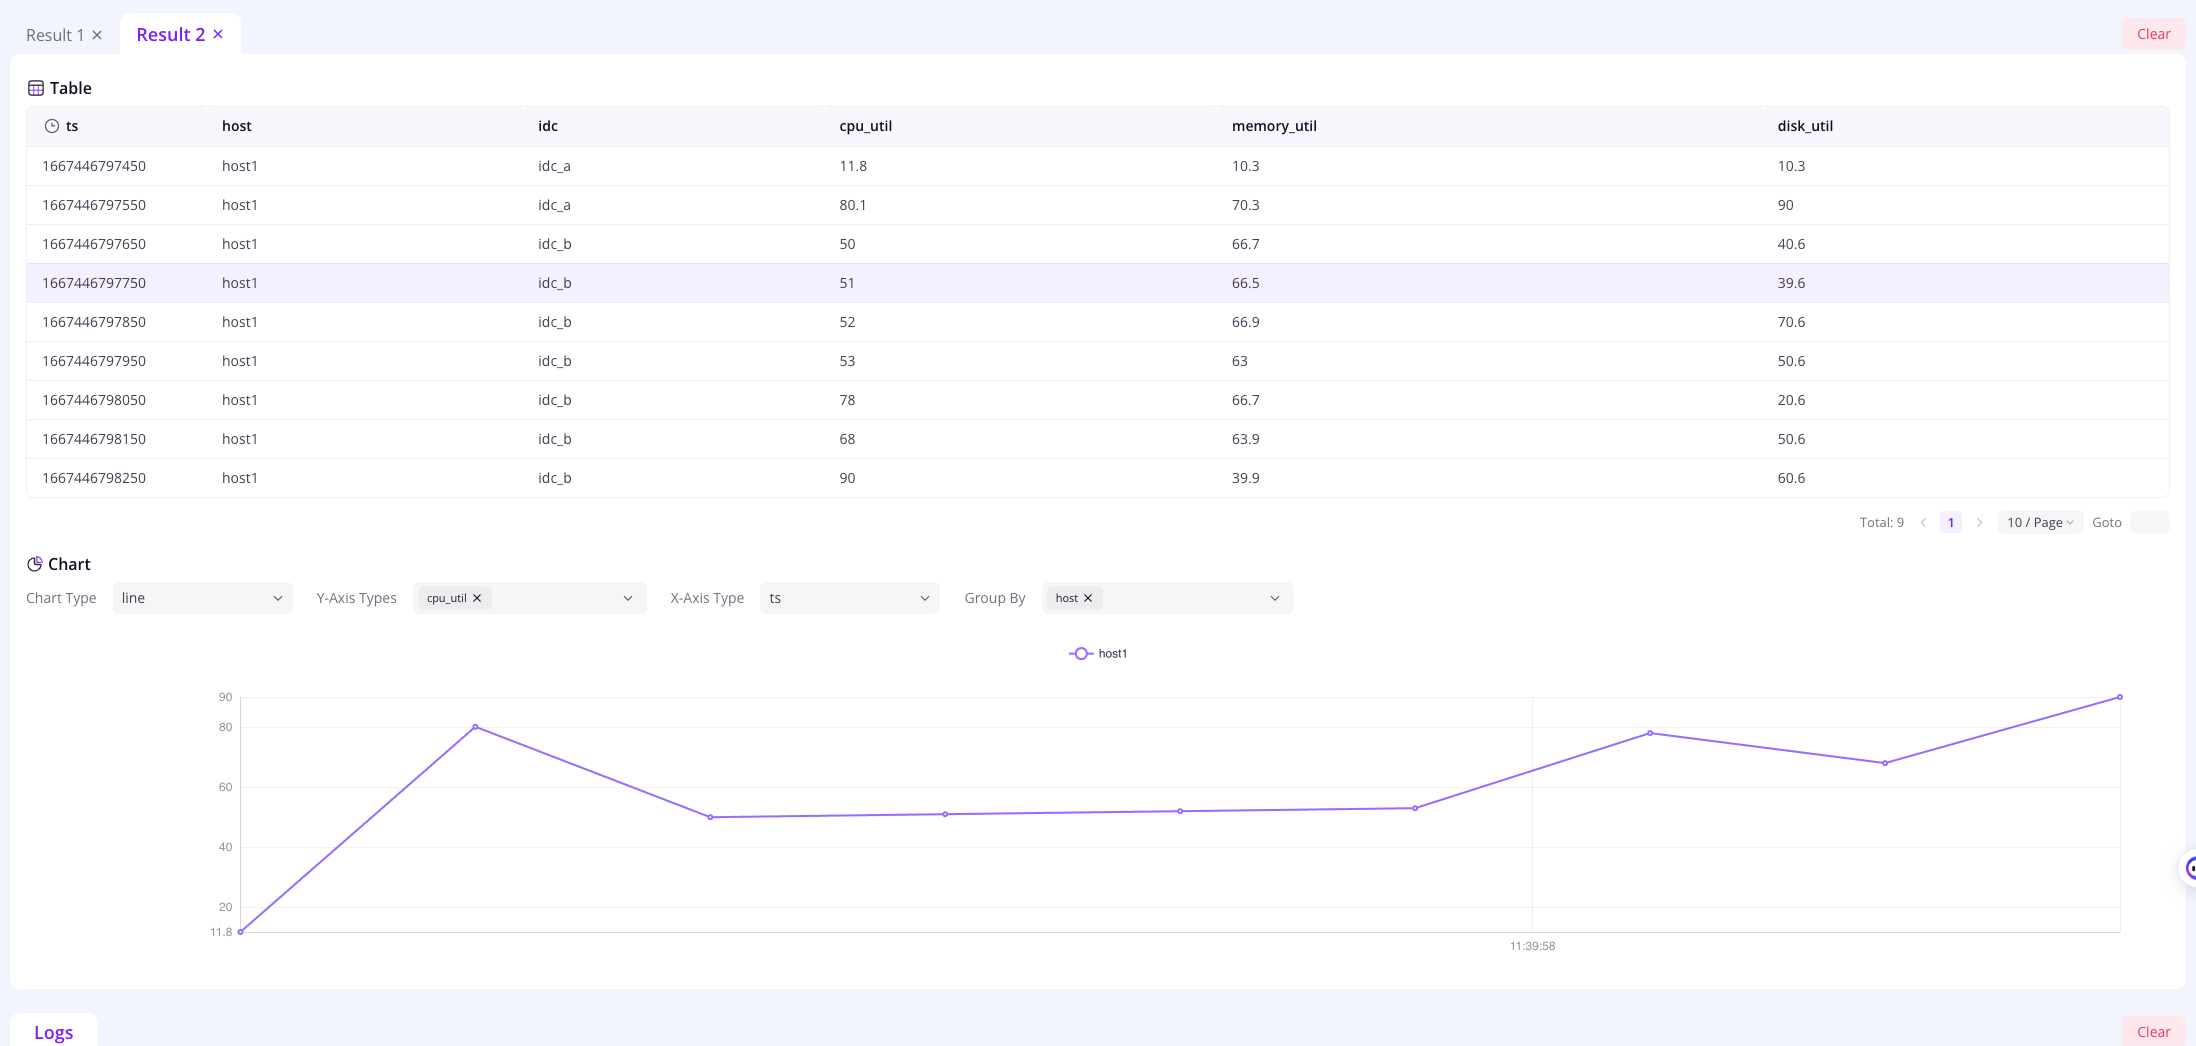
SELECT * FROM system_metrics;
If everything works as expected, you should be able to see the query results.

Let's log in to the AWS S3 console to verify that the data has been accurately written.

To enhance query performance, we recommend enabling the local file cache:
[storage]

cache_path = "/path/local_cache"
cache_capacity = "256MiB"
The cache_path specifies the directory for local caching, while cache_capacity determines the maximum size for local cache usage.
GreptimeDB offers various efficient solutions for those looking to harness the power of cloud storage while enjoying the familiar SQL interface. The integration with AWS S3 not only offers robust storage capabilities but also ensures data resilience and scalability.
We genuinely believe in the ability of GreptimeDB to transform your data management and query needs. If you haven't yet, we wholeheartedly encourage you to give GreptimeDB a try. Your feedback is invaluable to us, and we're eager to hear about your experiences and how GreptimeDB fits into your data ecosystem.


