On this page
Early this year, we released a private preview of our time-series DBaaS, GreptimeCloud, and a public playground based on it. After another 3 months of hard work, I'm glad to announce our next major milestone for GreptimeCloud: the Public Tech Preview.
In this release, we introduce a managed Prometheus solution for users who previously relies on open-source Prometheus for their application monitoring and analysis. Enhancements are also added to different tiers of the service to make it usable for more scenarios and a wider audience.
Bring your Prometheus data to Cloud
Prometheus, renowned for its simplicity and the potent capabilities of its query language, holds the title of being the most widely accepted open-source metrics solution. At Greptime, we place a strong emphasis on Prometheus compatibility. We have integrated support for its remote read/write protocols and implemented PromQL as one of our primary query languages. In the spirit of contributing to the open-source community, we have also made our Rust parser for PromQL publicly available.
These good features are all inherited on GreptimeCloud. By configuring your GreptimeCloud instance as a remote write endpoint, you store all metrics in a scalable cloud database. It is possible to query the data in native PromQL. Our compatibility with PromQL has reached more than 60% and we keep improving all the corner cases. SQL is also available if you are from a data-analytic background. You can even use the Prometheus data source from Grafana to connect to GreptimeCloud without any modification.
The compatibility with Prometheus is also seamlessly incorporated into GreptimeCloud. By configuring your GreptimeCloud instance as a remote write endpoint, you're able to store all metrics in a scalable cloud database and conveniently query this data using native PromQL. Our compatibility with PromQL has already surpassed the 60% mark, and we're continuously striving to improve and cover all edge cases. If you have a data analytics background, SQL querying is also readily available. What's more, you can connect to GreptimeCloud directly using the Prometheus data source in Grafana, requiring no modifications.
Manage Rules in GitOps way
Rules in Prometheus are designed to generate alerts and new data. As your data is now on cloud, we ported and extended Prometheus rules on GreptimeCloud as well (record rules to be supported later).
We have embraced the GitOps philosophy and leverage git as the CRUD API for managing your rules. We have found that Git serves as a perfect solution for rule management. With its robust version control, collaborative features, and widespread understanding among developers, it stands unrivaled.
By pushing your existing rules to your repository on GreptimeCloud, our engine periodically evaluates rules against your data and triggers webhook or your original alertmanager.
Built-in visualization
While there are several solutions available for data visualization with Prometheus as the backend, we've noticed that building these visualizations from scratch can be quite arduous. It requires an extensive amount of navigation through myriad options just to set up a single panel for a metric. However, typically, we need to display dozens of metrics to achieve a comprehensive overview of our system.
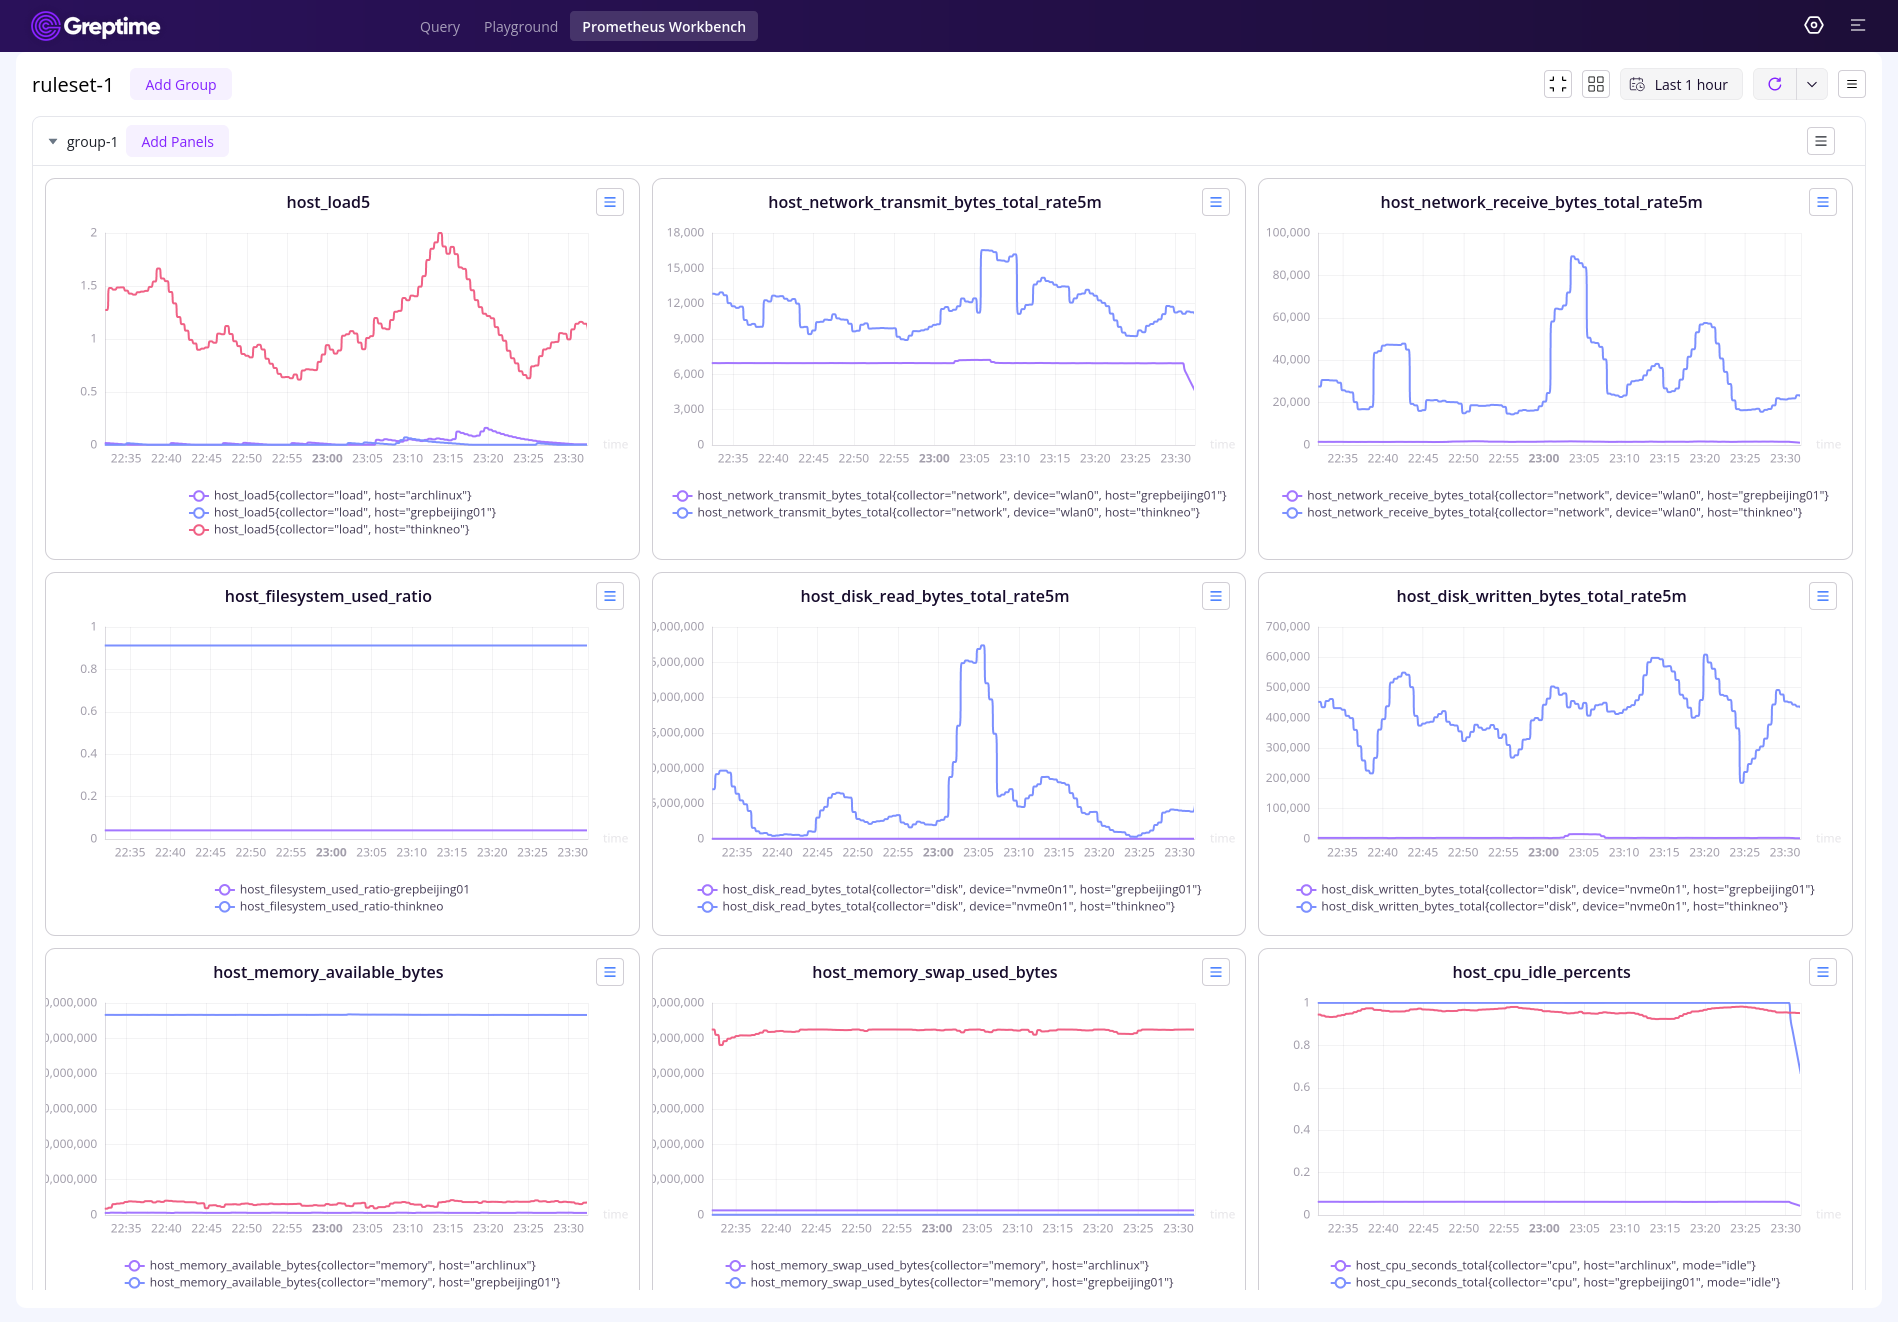
We extended Prometheus rules by adding a new kind of rule called visualization. On our Prometheus Workbench, we have a dashboard builder that emphasizes on high throughput when creating dashboards. With just a few clicks on a single screen, you can swiftly construct a dashboard tailored to your data. The rules, written in plain-text YAML, are once again managed by Git. You can even generate your own scripts and push them for activation. In favour of simplicity and speed, we've streamlined customization options. However, if your use case requires additional styling or diverse visualization options, you can still export our dashboard as a Grafana JSON model and import it into Grafana for further customization.
Serverless Backend Enhancement
The foundational architecture of GreptimeCloud's serverless DBaaS has undergone notable enhancements in this release. We offer "Tech Preview Plan" with a free tier for our early adopters. It includes a novel workload metrics system - the capacity units - designed to measure your reads/writes within the serverless database.
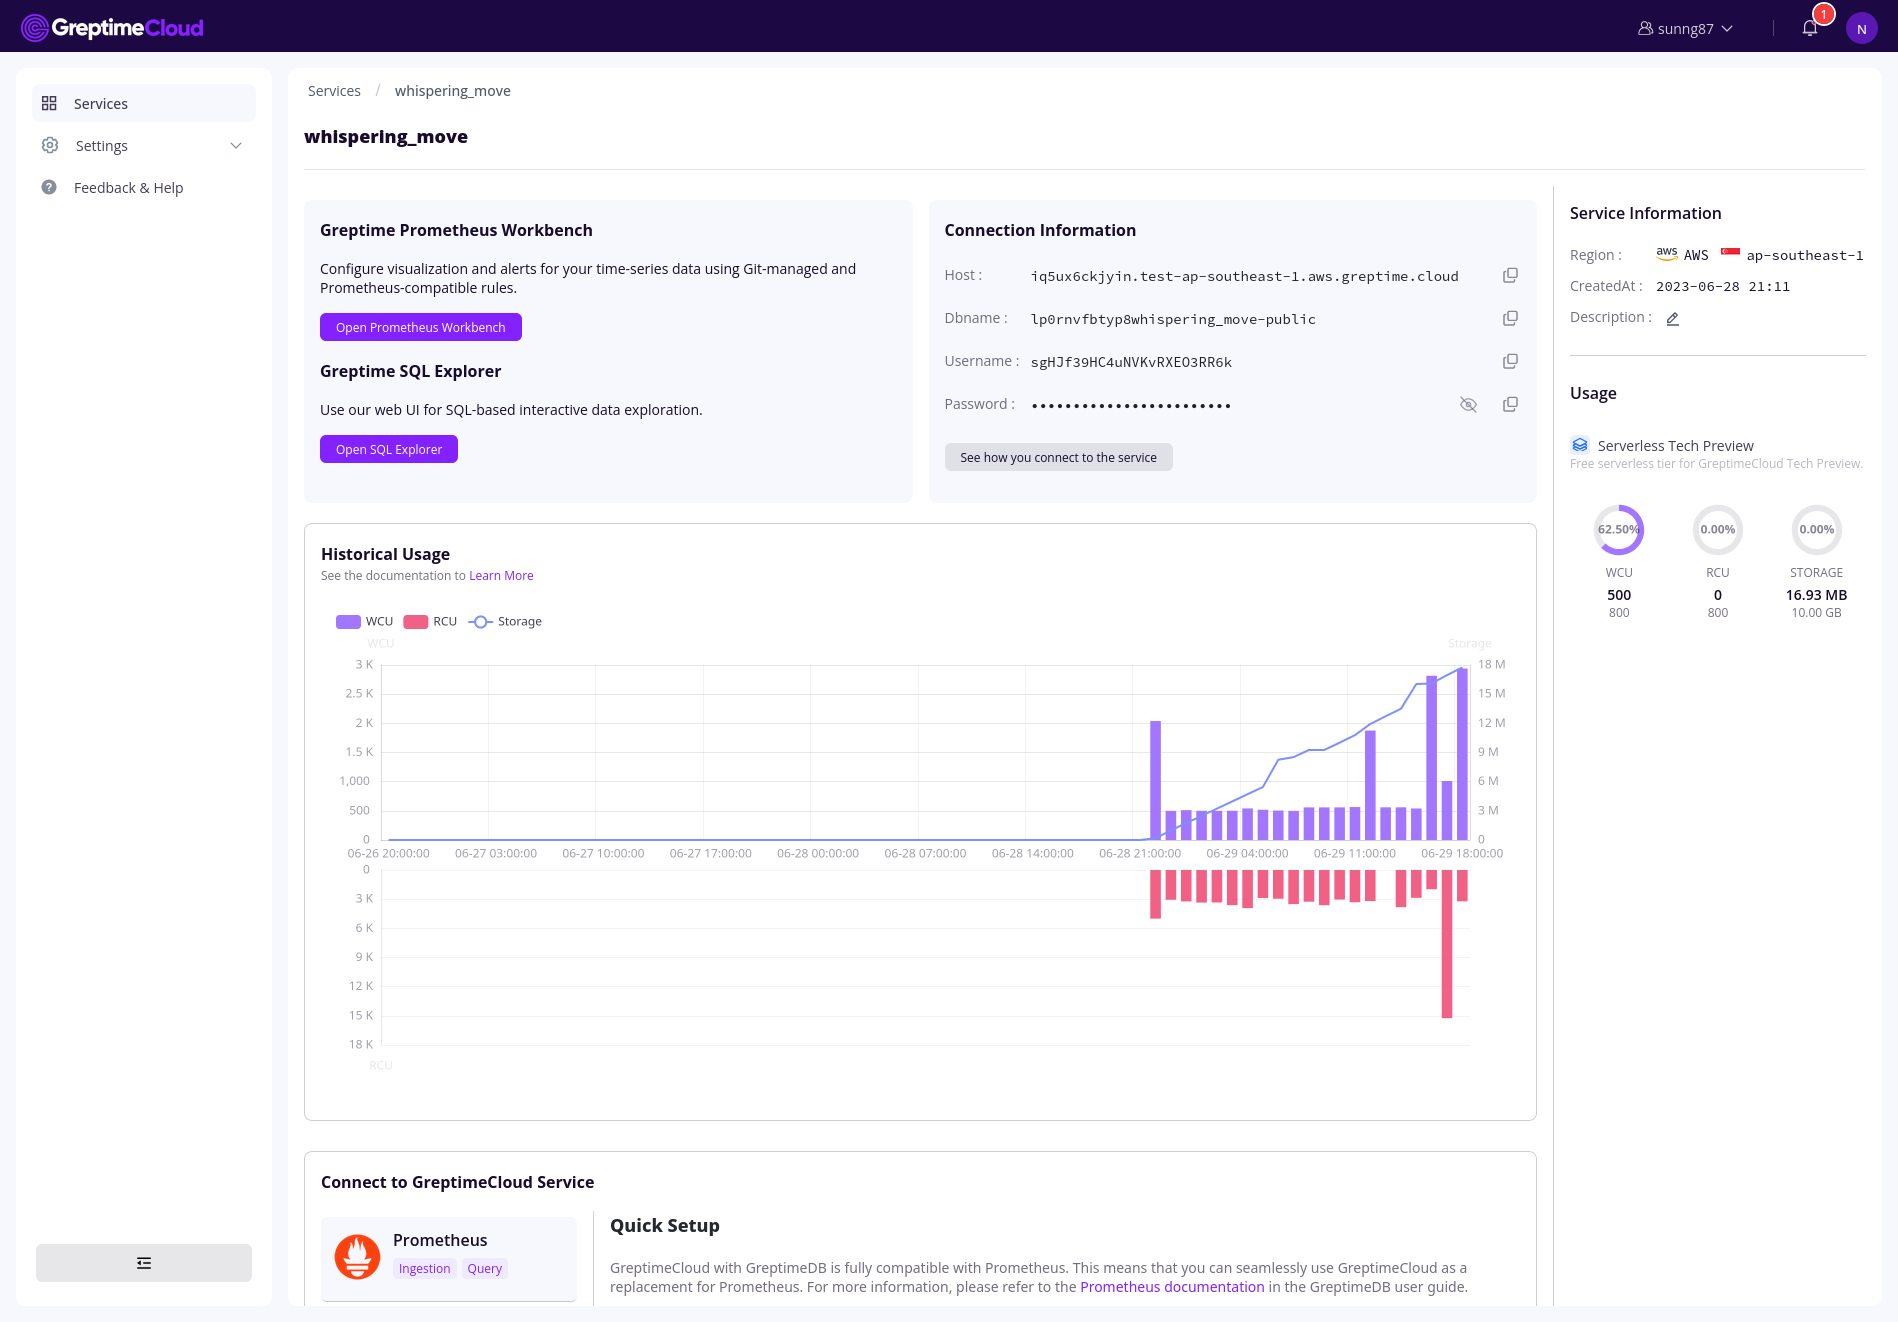
Once you've allocated a certain number of capacity units, you'll be able to perform read/write operations at a corresponding rate. This innovative approach eliminates the need for users to be concerned with aspects such as CPU cores, memory, bandwidth, or the number of instances. Rest assured that we'll handle resource scheduling on your behalf, ensuring smooth and efficient operations.
Detailed information about the usage of capacity units for reads (RCU) and writes (WCU) can be found in our documentation. We're also planning to delve into the technical aspects of this feature in future posts. During the tech preview period, we'll continue refining this mechanism. Our objective is to ensure not only comprehensibility from your perspective but also cost-effectiveness in its application.
Benefit from the separation of control and data plane, we also accept flexible deployment option as "Bring Your Own Cloud". This option allows you to use your dedicated infrastructure for your GreptimeCloud service instance, while harnessing the advantages of our global control plane facilities. If you would like to learn more about this option, please don't hesitate to contact us.
Conclusion
We're thrilled to have you explore the advantages of the tech preview version GreptimeCloud firsthand. During this trial, you will be allotted a designated amount of capacity units and gain full access to all our features, including our robust query language and user-friendly interface. We're confident that you'll find value in the transformative power of GreptimeCloud.
We greatly appreciate your feedback and are enthusiastic to learn your insights on how we could enhance our service. Our dedicated team of professionals stands ready to assist with any queries you may have and ensure you fully harness the potential of our platform. Should you encounter any issues, please don't hesitate to reach out. You can contact us directly via Slack, send an email to [email protected] or discuss anything related to Greptime on GitHub discussions.
Sign up for our free trial today and experience how our cloud service can revolutionize your handling of time-series data before the trial ends. We're eagerly anticipating your valuable feedback!


