On this page
Starting with greptimedb#1733, GreptimeDB has adopted Jemalloc as its default memory allocator. This change not only boosts performance and reduces memory fragmentation but also offers convenient memory analysis capabilities.
In our previous article, Diagnosing and Fixing Rust Memory Leak Issues in GreptimeDB, we explored several common methods for analyzing memory leaks in Rust applications.
Here in this article, I will delve into detailed techniques for troubleshooting based on Jemalloc. If you encounter any unusual memory usage issues while using or developing GreptimeDB, refer to this article for quick diagnostics and identification of potential memory leaks.
Preparations for Memory Leak Diagnosis
Install tools
- Install
flamegraph.plscript
Bash
curl -s https://raw.githubusercontent.com/brendangregg/FlameGraph/master/flamegraph.pl > ${HOME}/.local/bin/flamegraph.pl
chmod +x ${HOME}/.local/bin/flamegraph.pl
export PATH=$PATH:${HOME}/.local/bin
flamegraph.pl, authored by Brendan Gregg, is a Perl script designed for visualizing hot spots in code call stacks. Brendan Gregg is an expert in system performance optimization. We are grateful to him for developing and open-sourcing numerous tools, includingflamegraph.pl.
- Install
jeprofcommand
Bash
# For Ubuntu
sudo apt install -y libjemalloc-dev

# For Fedora
sudo dnf install jemalloc-devel
For other operating systems, you can find the dependency packages for
jeprofthrough pkgs.org.
Enabling Heap Profiling in GreptimeDB
The heap profiling feature in GreptimeDB is turned off by default. You can enable this feature by turning on the mem-prof feature when compiling GreptimeDB.
Bash
cargo build --release -F mem-profThe discussion about whether the
mem-proffeature should be enabled by default is ongoing in greptimedb#3166. You are welcome to share your opinion there.
Starting GreptimeDB with mem-prof Feature
To enable the heap profiling feature, you need to set the MALLOC_CONF environment variable when starting the GreptimeDB process:
Bash
MALLOC_CONF=prof:true <path_to_greptime_binary> standalone startYou can use curl command to check if heap profiling is enabled.
Bash
curl <greptimedb_ip>:4000/debug/prof/memIf the heap profiling feature is turned on, executing the curl command should yield a response similar to the following:
Plain
heap_v2/524288
  t*: 125: 136218 [0: 0]
  t0: 59: 31005 [0: 0]
...

MAPPED_LIBRARIES:
55aa05c66000-55aa0697a000 r--p 00000000 103:02 40748099                  /home/lei/workspace/greptimedb/target/debug/greptime
55aa0697a000-55aa11e74000 r-xp 00d14000 103:02 40748099                  /home/lei/workspace/greptimedb/target/debug/greptime
If you receive the response {"error":"Memory profiling is not enabled"}, it indicates that the MALLOC_CONF=prof:true environment variable has not been set correctly.
TIP
- The memory profiling endpoint has been moved from
/v1/prof/memto/debug/prof/memsince v0.9.5. - For information on the data format returned by the heap profiling API, refer to the HEAP PROFILE FORMAT - jemalloc.net.
Begin your Memory Exploration Journey
By using the command curl <greptimedb_ip>:4000/debug/prof/mem, you can quickly obtain details of the memory allocated by GreptimeDB. The tools jeprof and flamegraph.pl can be used to visualize memory usage details into a flame graph:
Bash
# To get memory allocation details
curl <greptimedb_ip>:4000/debug/prof/mem > mem.hprof

# To generate a flame graph of memory allocation
jeprof <path_to_greptime_binary> ./mem.hprof --collapse | flamegraph.pl > mem-prof.svg
After executing the above commands, a flame graph named 'mem-prof.svg' will be generated in the working directory.
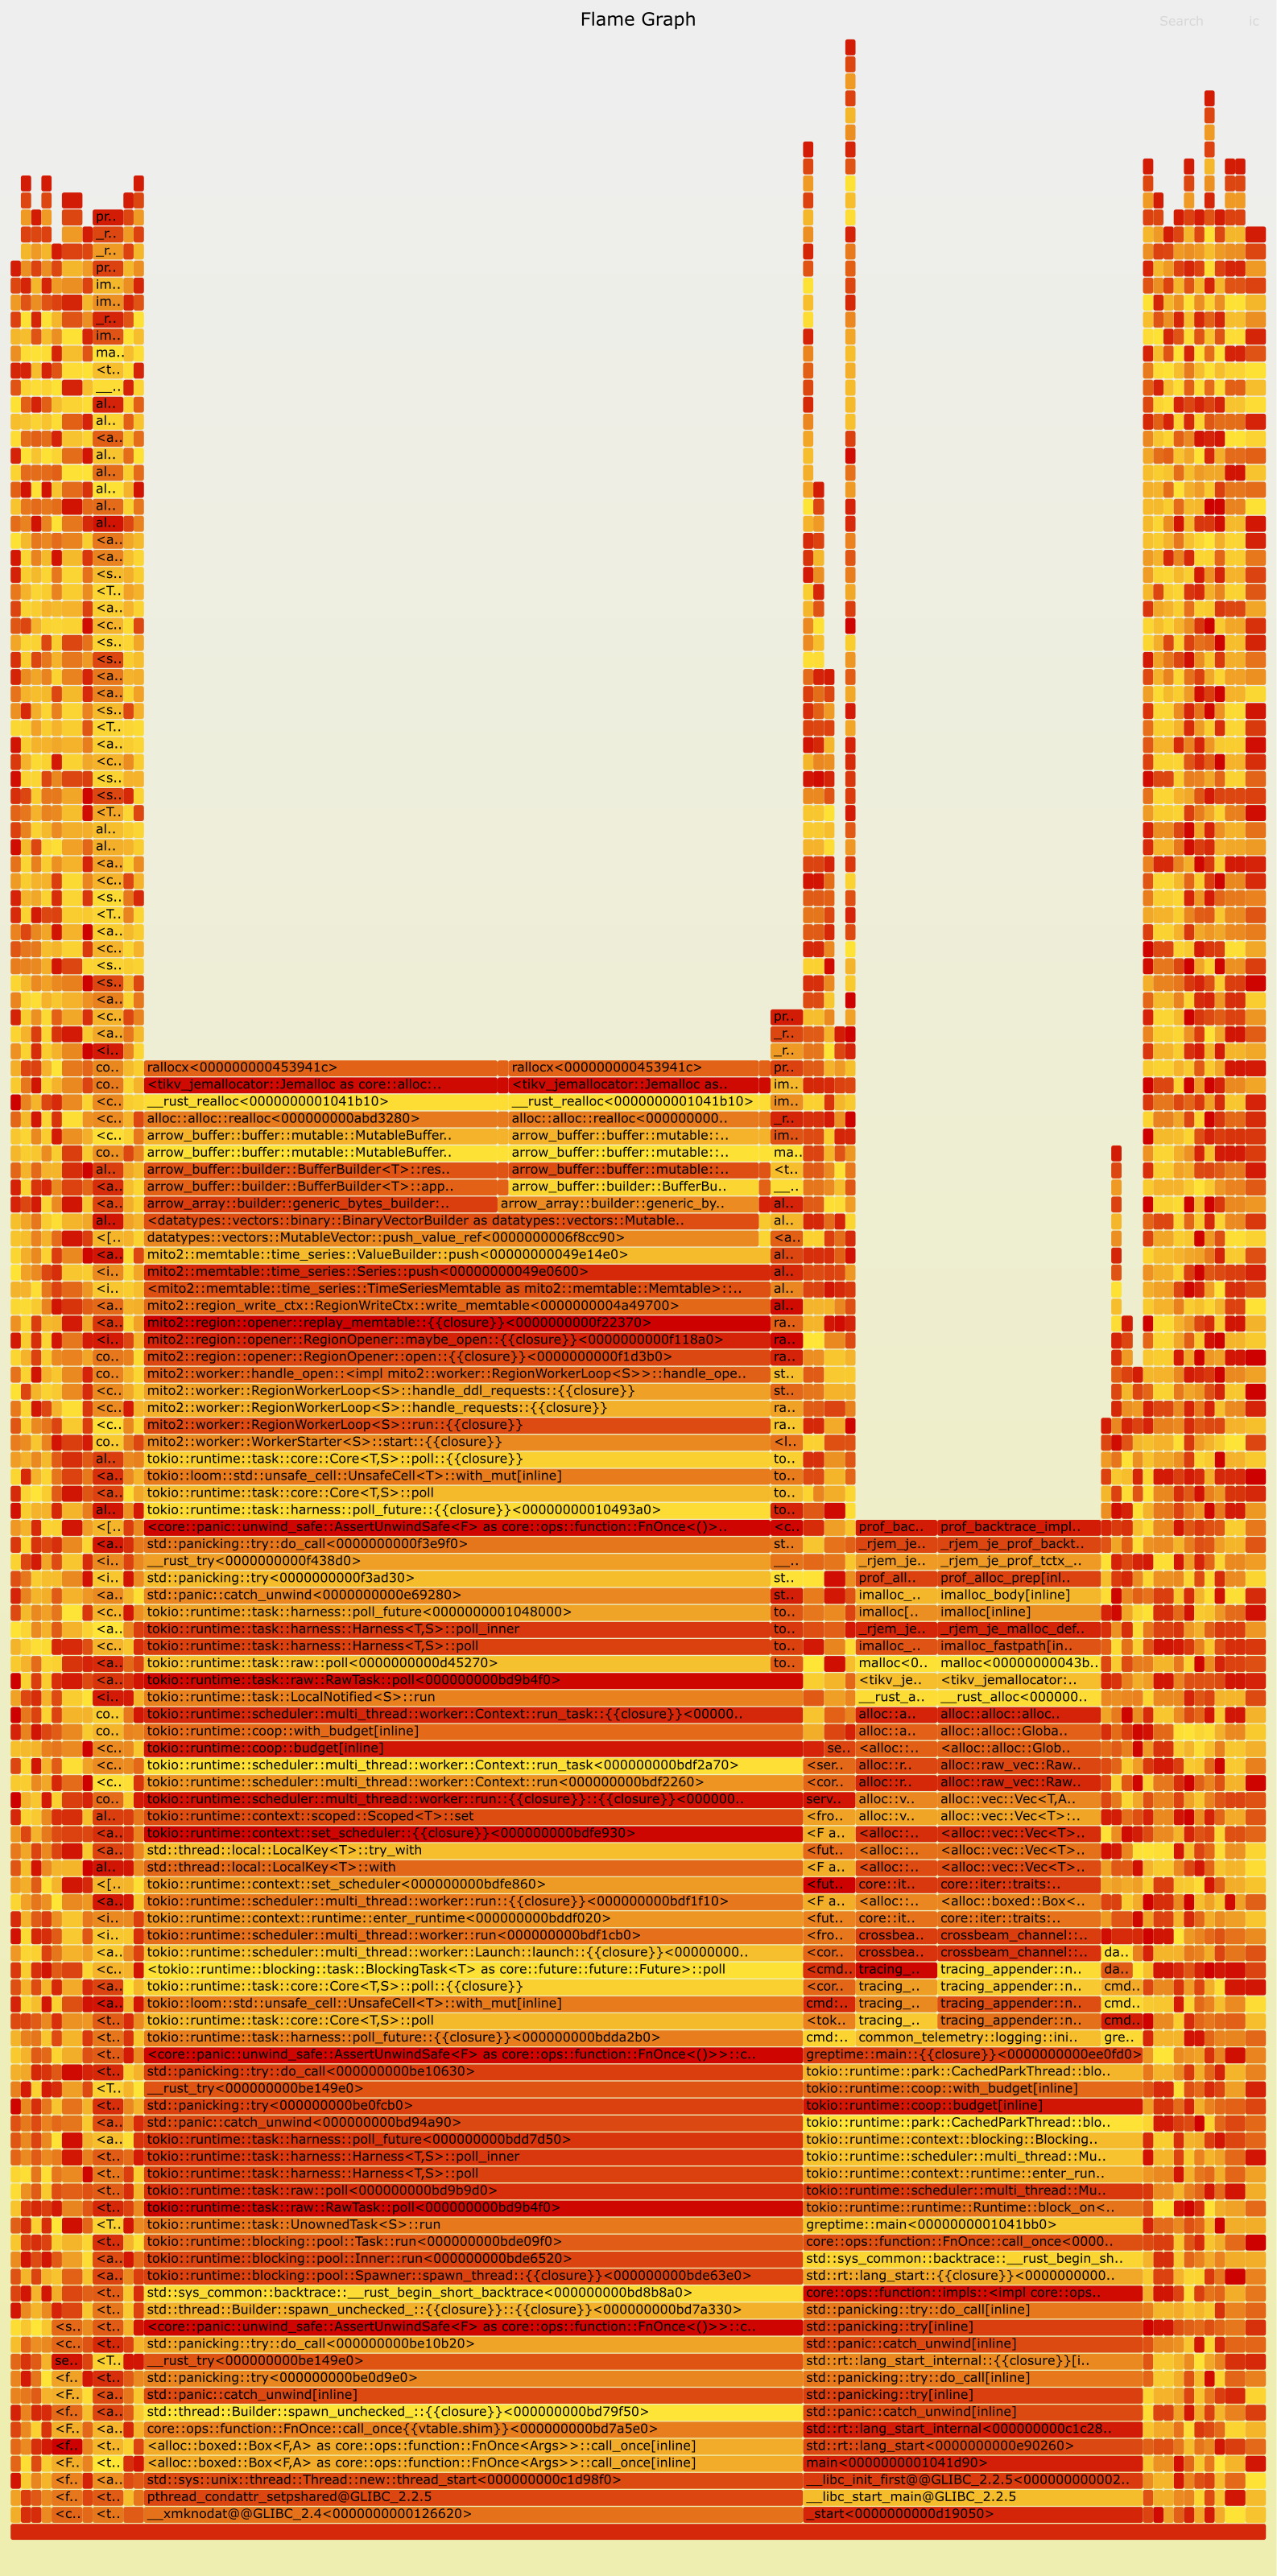
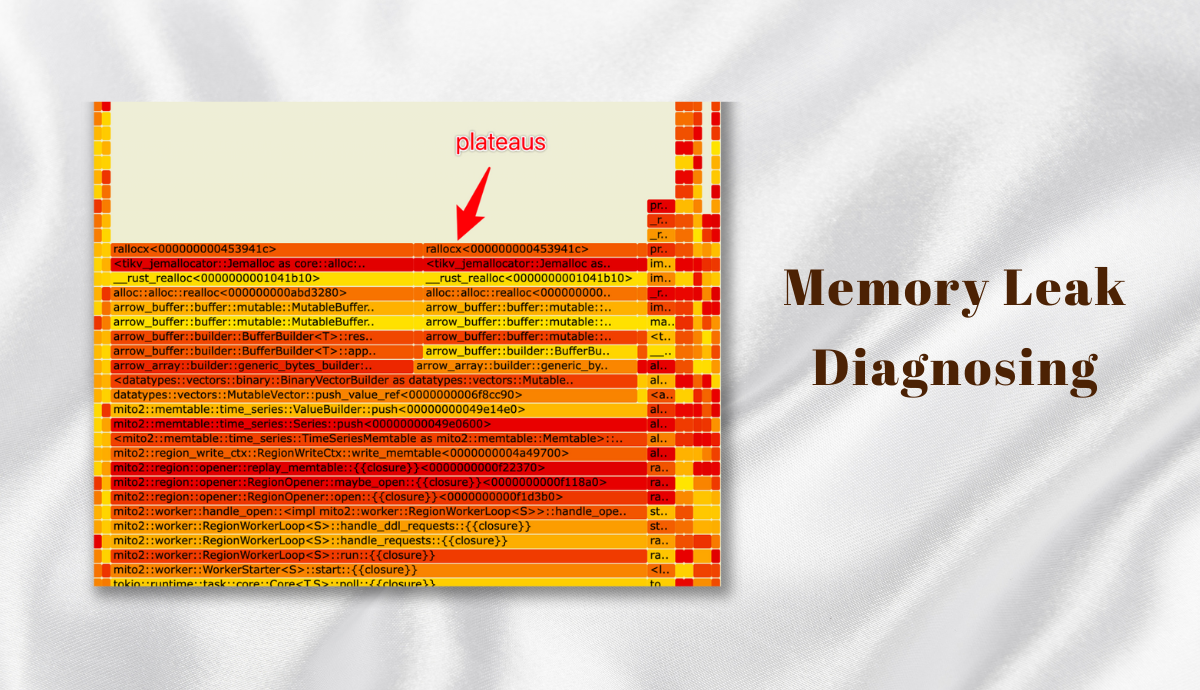
How to Interpret the Flame Graph
Created by Brendan Gregg, the flame graph is a powerful tool for analyzing CPU overhead and memory allocation details. Its principle of generation is based on recording the function call stack that triggers each memory allocation event during each memory sampling.
After recording a sufficient number of times, the call stacks of each allocation are merged, thus revealing the memory size allocated by each function call and its child function calls.
The bottom of the flame graph represents the base of the function stack, while the top represents the stack top.
Each cell in the flame graph represents a function call, with the cells below it being the callers of that function, and the cells above being the callees, the functions that it calls.
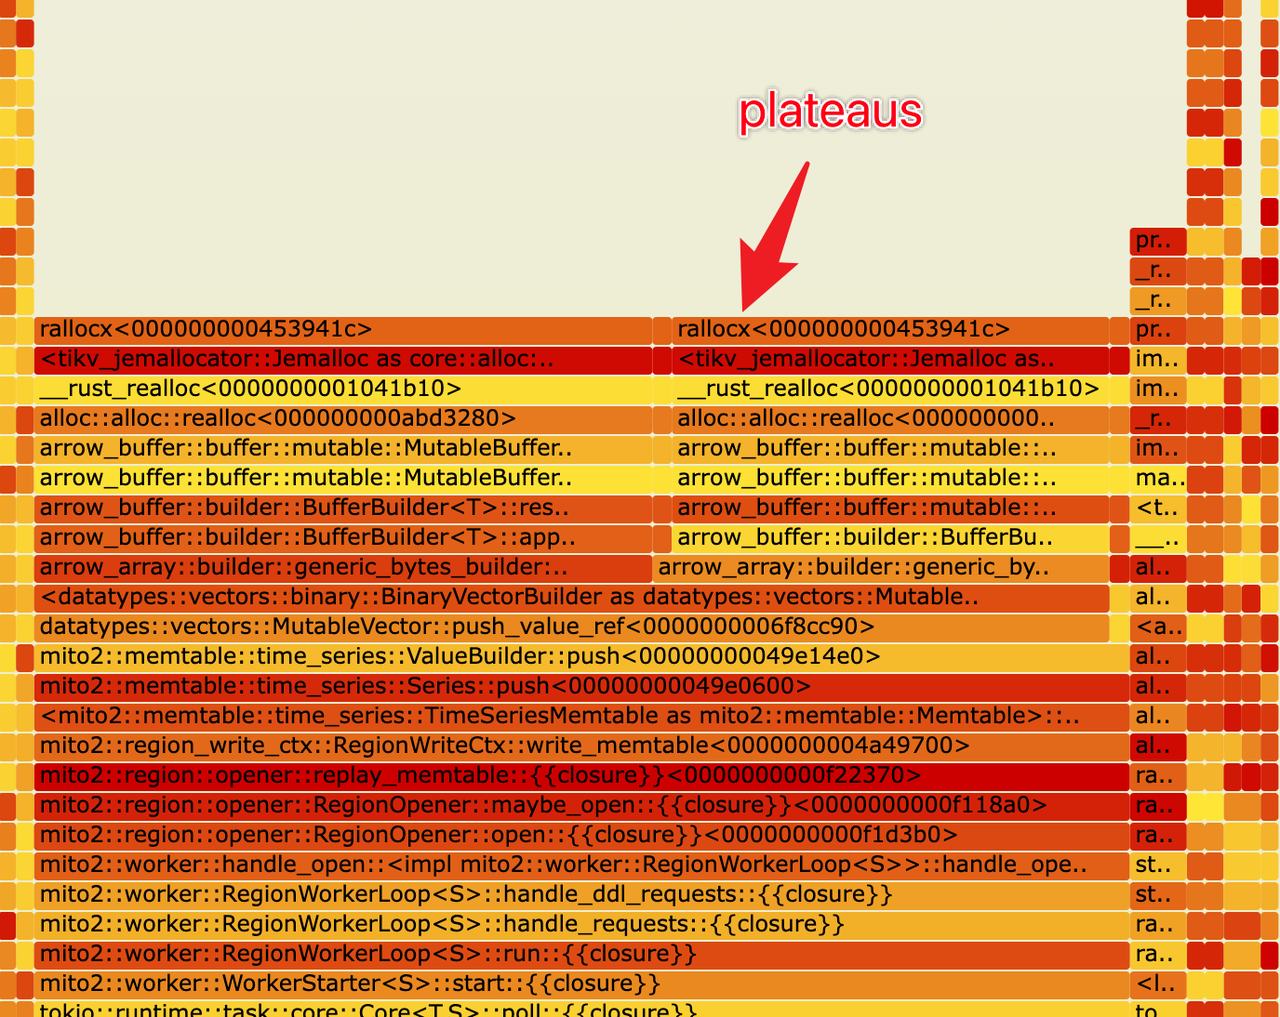
The width of a cell indicates the total amount of memory allocated by that function and its child functions. Wider cells indicate that those functions are allocating more memory. If some functions allocate a lot of memory but they do not have many child functions (as shown in the diagram, with wider stack tops in the flame graph, known as plateaus), it suggests that these functions themselves might have a substantial number of allocation operations.
The color of each cell in the flame graph is a random warm color.
Opening the flame graph's SVG file in a browser allows for interactive clicking into each function for more detailed analysis.
Accelerating Flame Graph Generation
The heap memory details returned by Jemalloc include the addresses of each function in the call stack. Generating the flame graph requires translating these addresses into file names and line numbers, which is the most time-consuming step. Typically on Linux systems, this task is accomplished by the addr2line tool from GNU Binutils.
To speed up the generation of the flame graph, we can replace the Binutils addr2line tool with glimi-rs/addr2line, thereby achieving at least a 2x increase in speed.
Bash
git clone https://github.com/gimli-rs/addr2line
cd addr2line
cargo build --release
sudo cp /usr/bin/addr2line /usr/bin/addr2line-bak
sudo cp target/release/examples/addr2line /usr/bin/addr2line
Catching Memory Leaks through Allocation Differences
In most memory leak cases, the usage of memory tends to increase slowly. Therefore, during the process of memory growth, capturing memory usage at two different time points and analyzing the difference between them often points to potential memory leaks.
We can collect the memory data at the initial time point to establish a baseline:
Bash
curl -s <greptimedb_ip>:4000/debug/prof/mem > base.hprofWhen memory usage increases slowly, which suggests a possible memory leak, we should collect the memory data again:
Bash
curl -s <greptimedb_ip>:4000/debug/prof/mem > leak.hprofThen, using 'base.hprof' as a baseline, analyze the memory usage and generate a flame graph:
Bash
jeprof <path_to_greptime_binary> --base ./base.hprof ./leak.hprof --collapse | flamegraph.pl > leak.svgIn the flame graph generated with the --base parameter specifying the baseline, only the memory allocation differences between the current memory collection and the baseline will be included. This allows for a clearer understanding of which function calls are responsible for the increase in memory usage.
Reference
- https://rust-lang.github.io/rfcs/1974-global-allocators.html#jemalloc
- https://www.brendangregg.com/FlameGraphs/memoryflamegraphs.html
- https://github.com/gimli-rs/addr2line
- https://github.com/GreptimeTeam/greptimedb/pull/1733
- https://github.com/GreptimeTeam/greptimedb/pull/1124
About Greptime
Greptime offers industry-leading time series database products and solutions to empower IoT and Observability scenarios, enabling enterprises to uncover valuable insights from their data with less time, complexity, and cost.
GreptimeDB is an open-source, high-performance time-series database offering unified storage and analysis for metrics, logs, and events. Try it out instantly with GreptimeCloud, a fully-managed DBaaS solution—no deployment needed!
The Edge-Cloud Integrated Solution combines multimodal edge databases with cloud-based GreptimeDB to optimize IoT edge scenarios, cutting costs while boosting data performance.
Star us on GitHub or join GreptimeDB Community on Slack to get connected.


