Last week, we unveiled the GreptimeDB roadmap for 2024, charting out several significant updates slated for this year.
With the advent of spring in early March, we also welcomed the debut of the first production-grade version of GreptimeDB. v0.7 represents a crucial leap toward achieving production readiness; it implements production-ready features for cloud-native monitoring scenarios. We eagerly invite the entire community to engage with this release and share their invaluable feedback through Slack.
From v0.6 to v0.7, the Greptime team has made significant strides: A total of 184 commits were merged, 705 files were modified, including 82 feature enhancements, 35 bug fixes, 19 code refactors, and a substantial amount of testing work.
During this period, a total of 8 individual contributors participated in the code contributions. Special thanks to Eugene Tolbakov for being continuously active in GreptimeDB's development as our first committer!
Update Highlights
- Metric Engine: crafted specifically for Observability scenarios. It's adept at managing a vast array of small tables, making it ideal for cloud-native monitoring.
- Region Migration: enhance the user experience, simplifying region migrations with straightforward SQL commands.
- Inverted Index: dramatically improves the efficiency of locating data segments relevant to user queries, significantly reducing the IO operations needed for scanning data files and thus accelerating the query process.
Now, let's dive deep into the updates in v0.7.
Region Migration
Region Migration provides the capability to migrate regions of a data table between Datanodes. Leveraging this feature, we can easily implement hot data migration and horizontal scaling for load balancing. GreptimeDB mentioned an initial implementation of Region Migration in v0.6. In v0.7, we have further refined the feature and enhanced the user experience.
Now, we can conveniently execute region migration through SQL commands:
select migrate_region(
    region_id,
    from_dn_id,
    to_dn_id,
    [replay_timeout(s)]);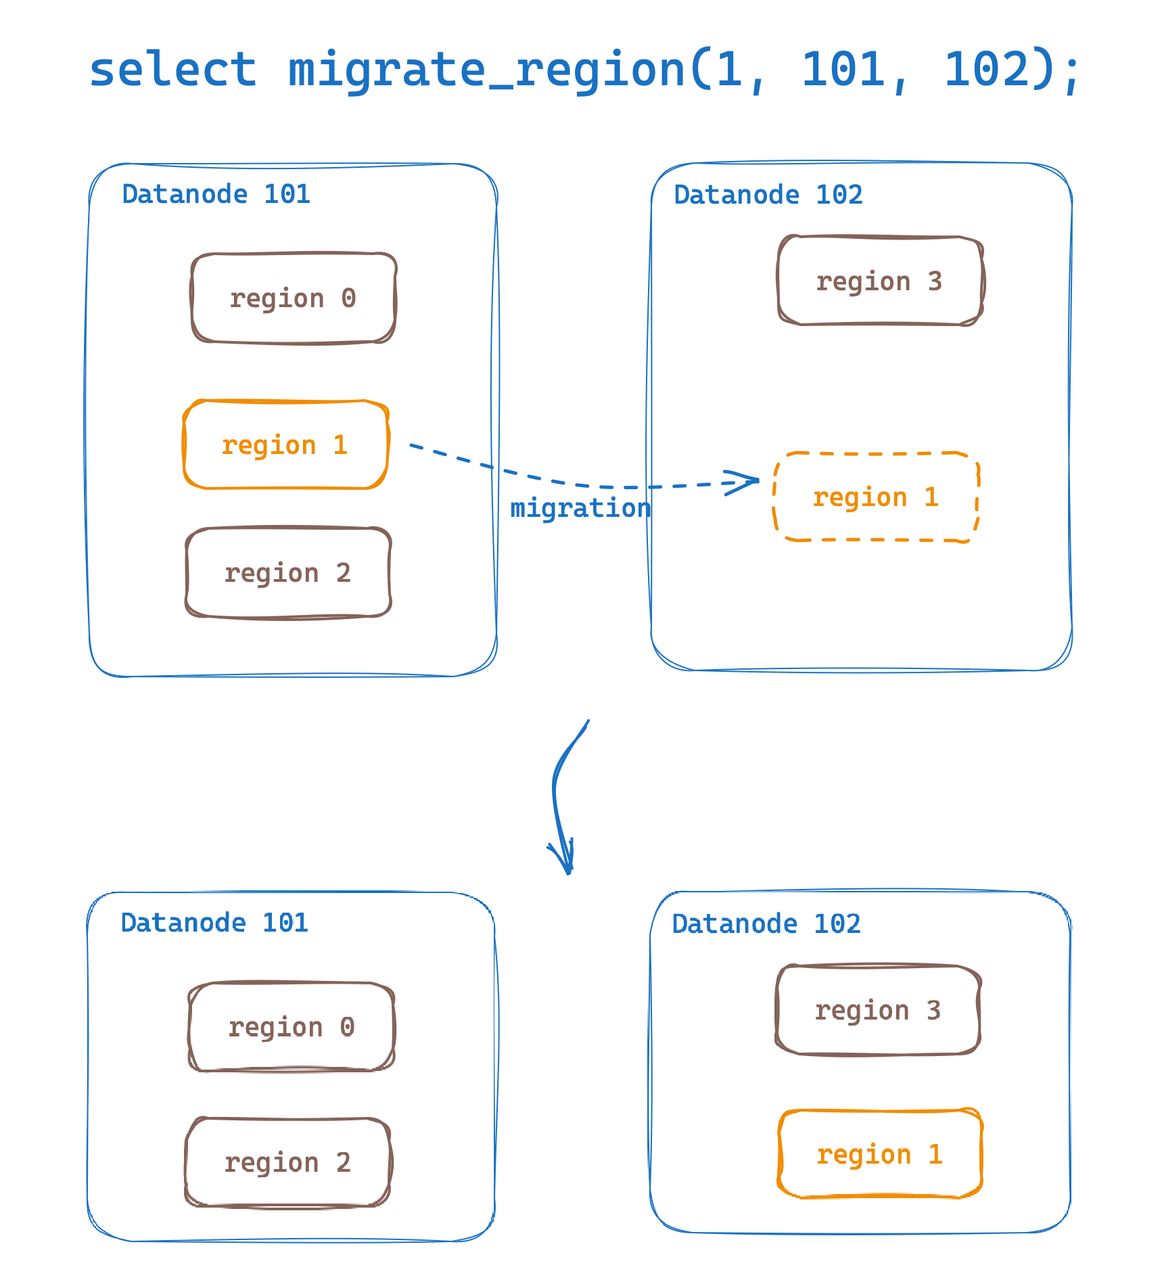
Metric Engine
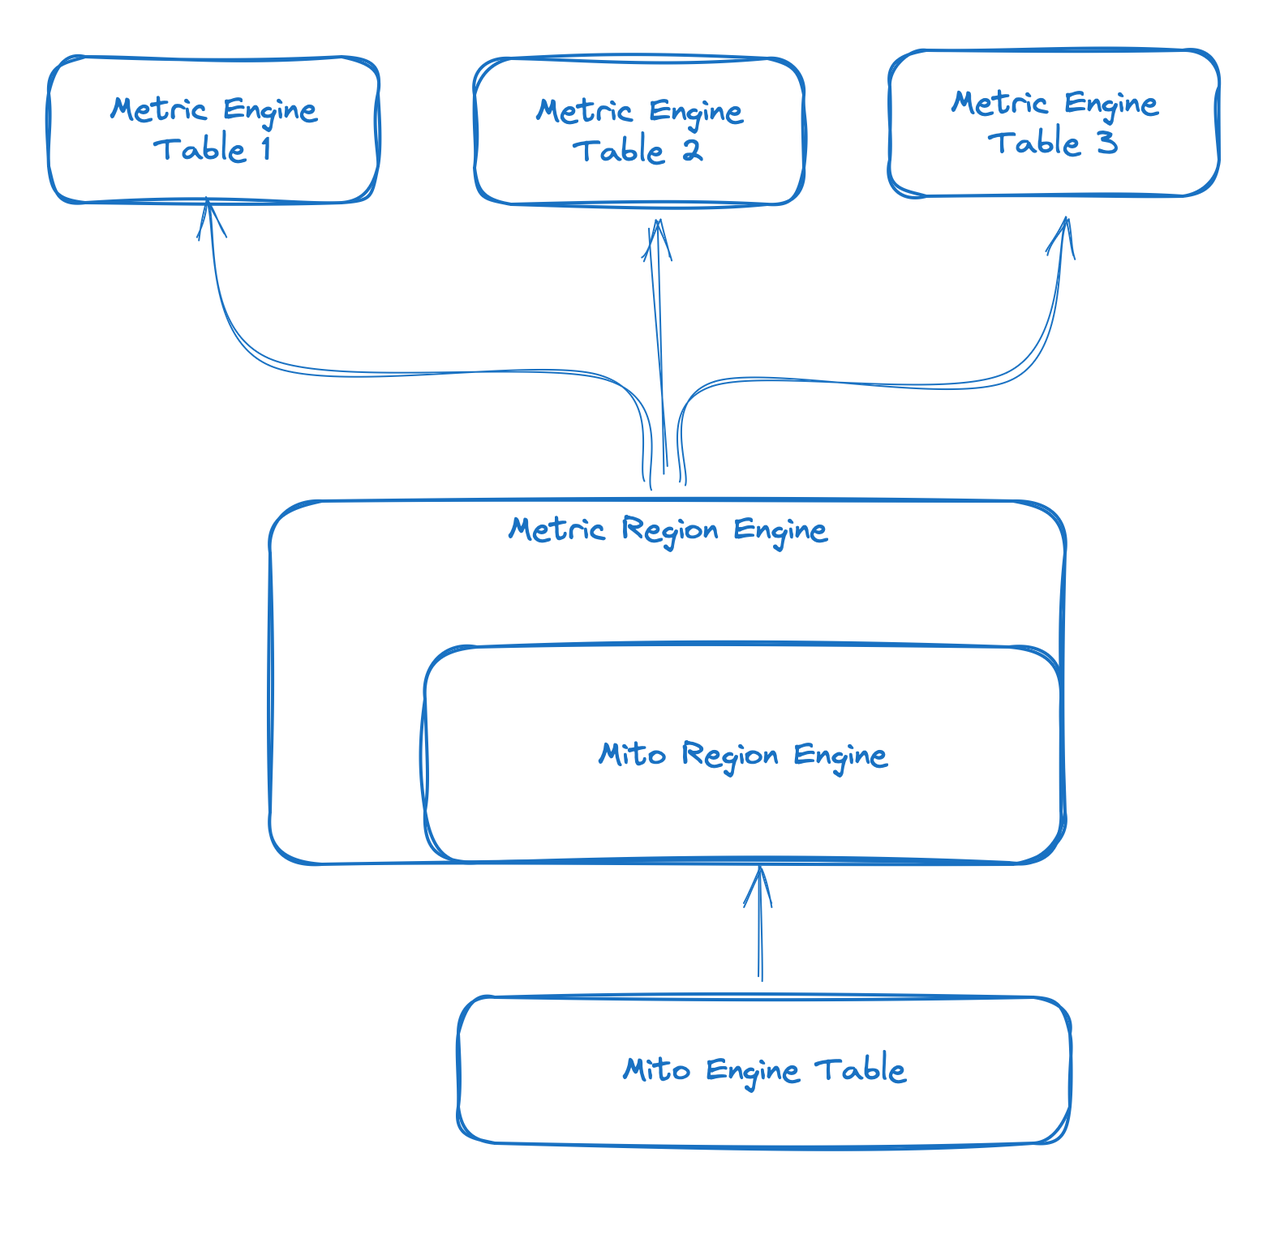
The Metric Engine is a brand-new engine designed specifically for Observability scenarios. The primary goal of Metric Engine is to handle a large number of small tables, making it particularly suitable for cloud-native monitoring, such as scenarios previously using Prometheus. By leveraging the synthetic wide tables, this new engine offers the capability for metric data storage and metadata reuse, making "tables" more lightweight. It can overcome some of the limitations of the current Mito engine, where tables are too heavy weight.
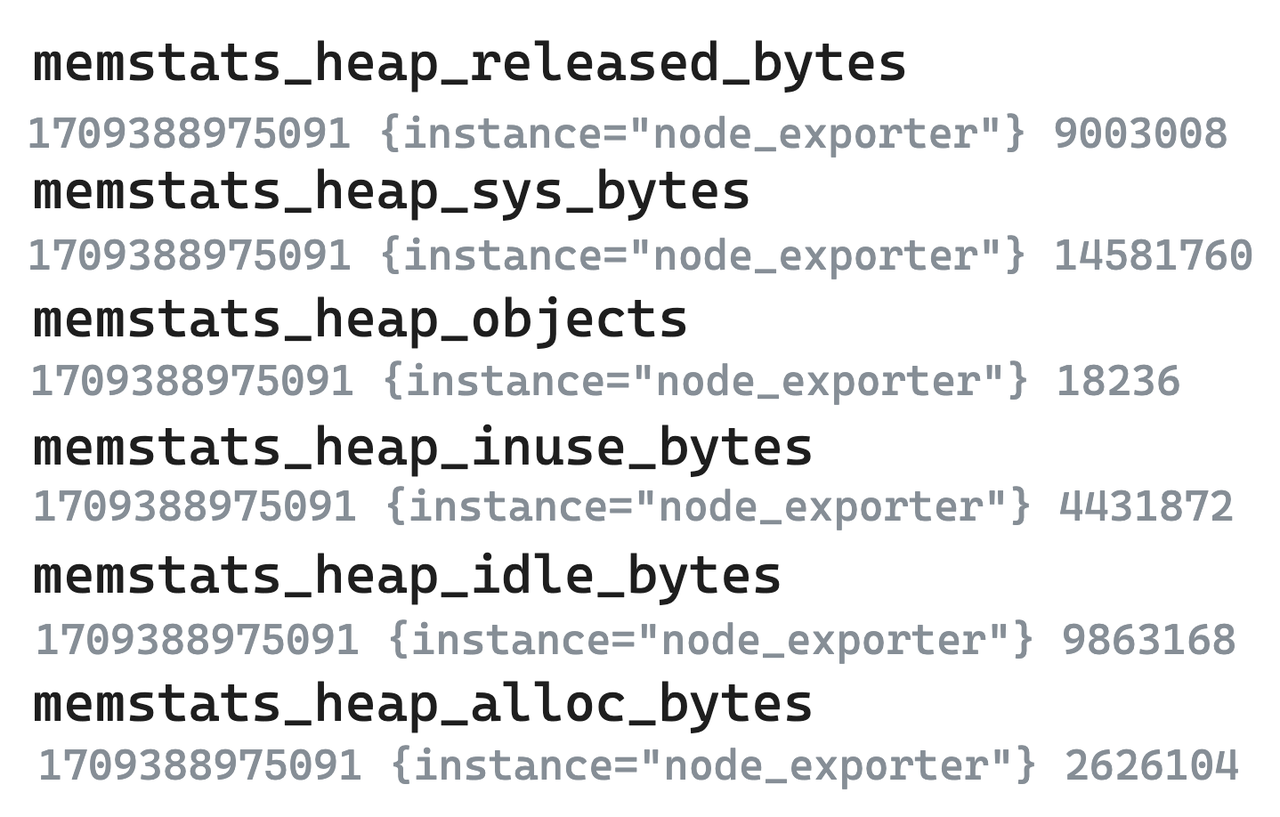
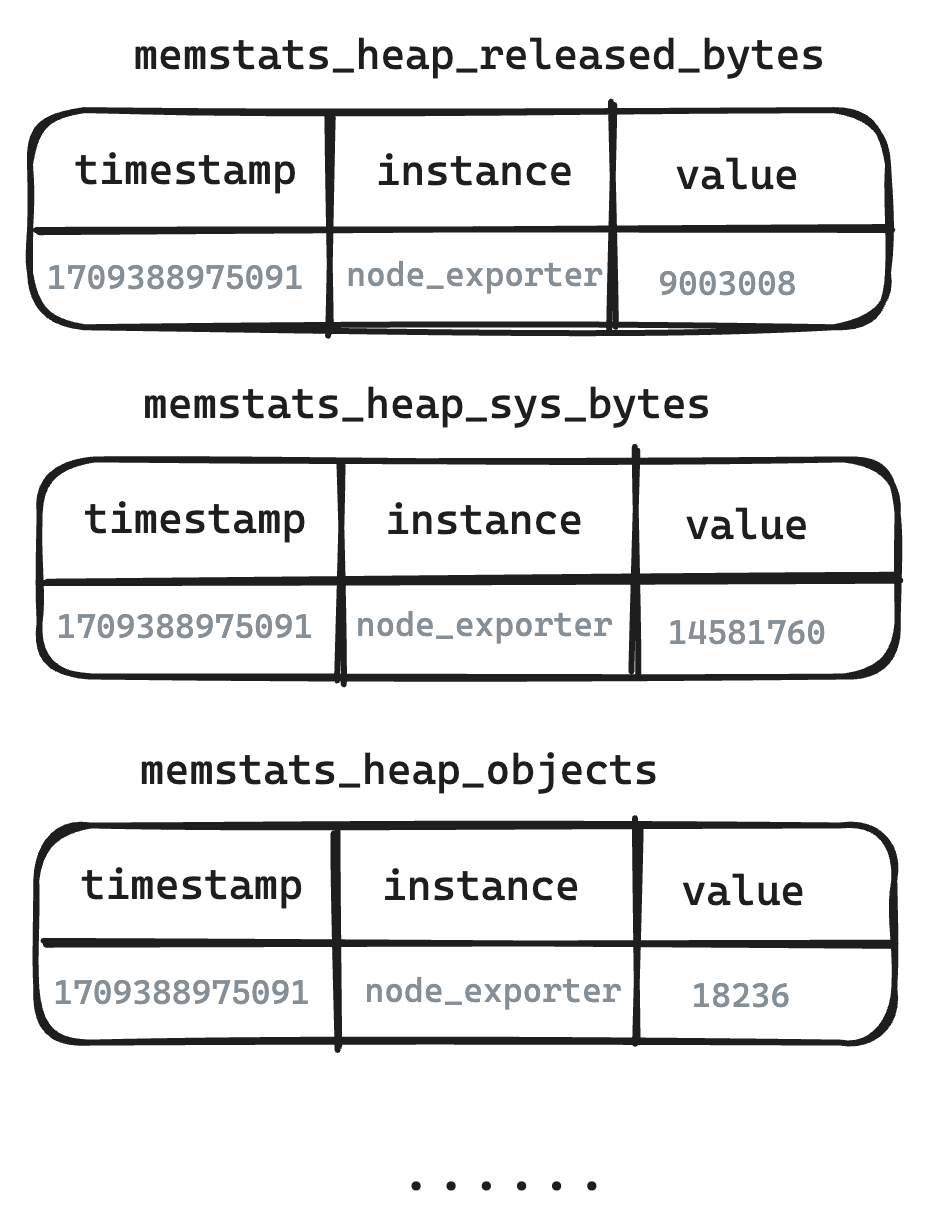
- Original Metric Data
- Taking the metrics from the following six node exporters as an example. In the single-value model systems represented by Prometheus, even highly correlated metrics need to be split and stored separately.
- Logical Table from User's Perspective
- The Metric Engine authentically reproduces the structure of Metrics, presenting users with the exact structure of the Metrics as they were written.
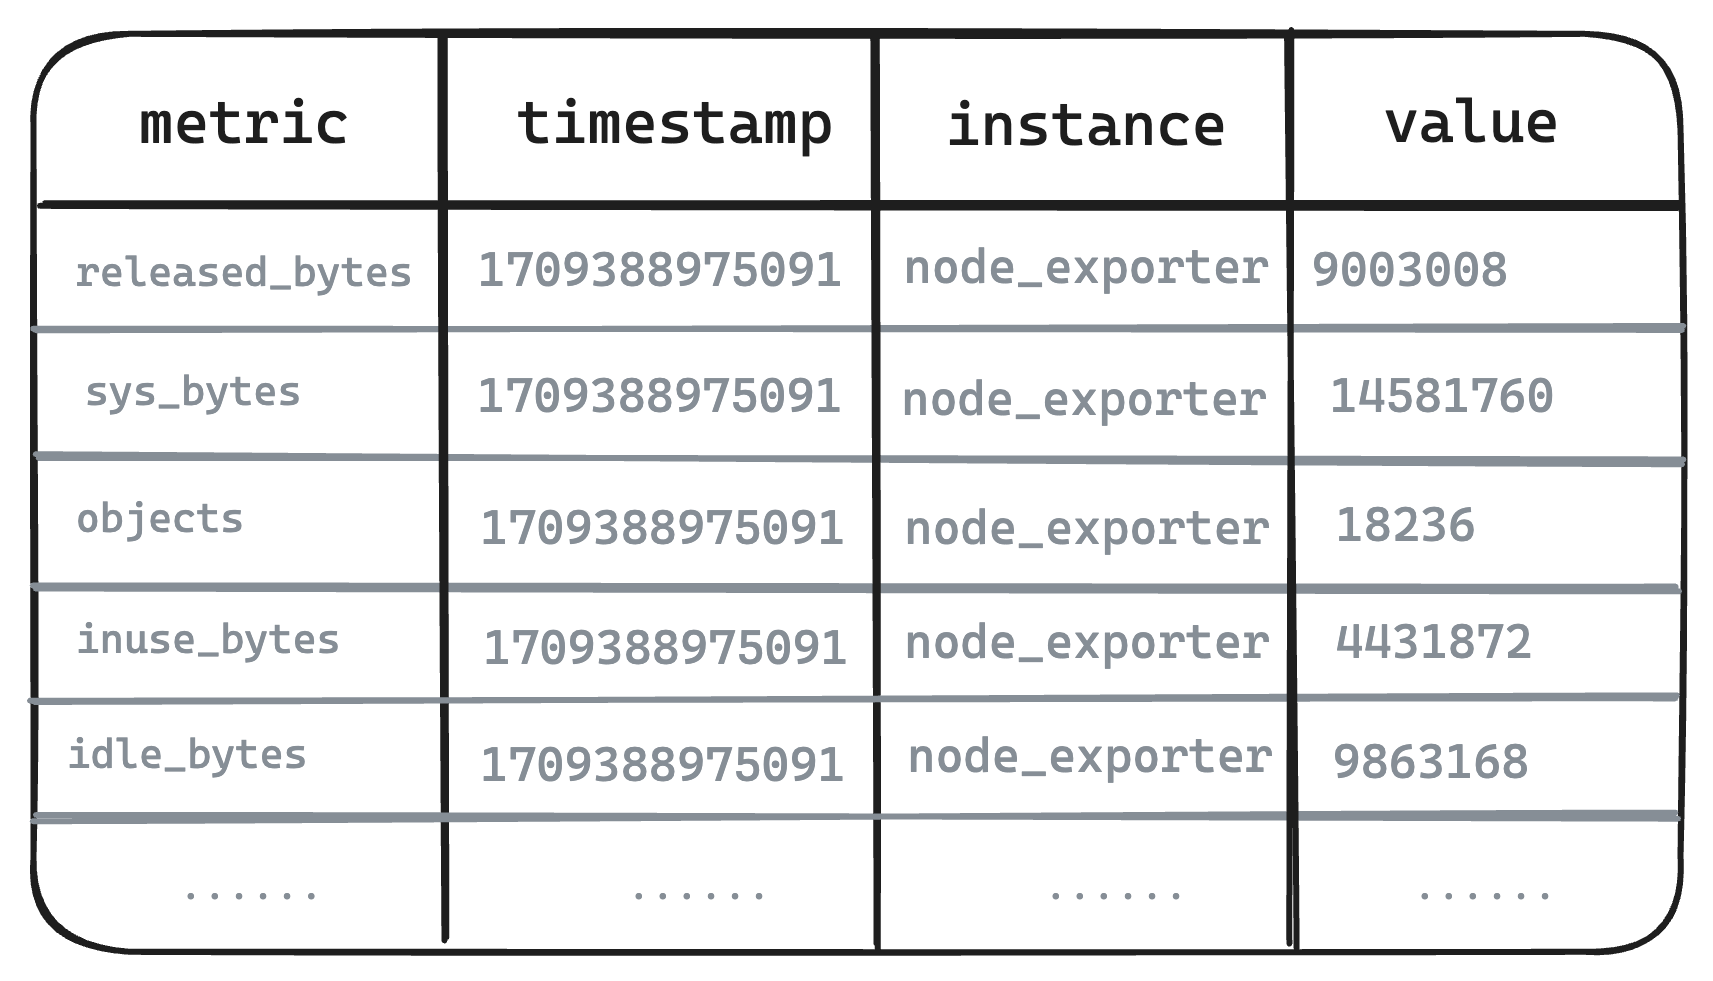
- Physical Table from the Storage Perspective
- At the storage layer, the Metric Engine performs mapping, using a single physical table to store related data. This approach reduces storage costs and supports the storage of Metrics at a larger scale.
- Upcoming Development Plan: Automatic Field Grouping
- In real-world scenarios that generate Metrics, the majority of these metrics are interconnected. GreptimeDB will possess the capability to automatically identify related metrics and consolidate them. This approach will not only decrease the number of timelines across various metrics but also enhance the efficiency of handling queries across multiple metrics.

- Lower Storage Cost
- To conduct cost testing based on the AWS S3 storage backend, data is written for approximately thirty minutes at a total write rate of about 300k rows per second. The number of operations occurring during the test is tallied to estimate the cost based on AWS's pricing. The index function is enabled throughout the testing process.
Pricing references are taken from the Standard tier at https://aws.amazon.com/s3/pricing/.
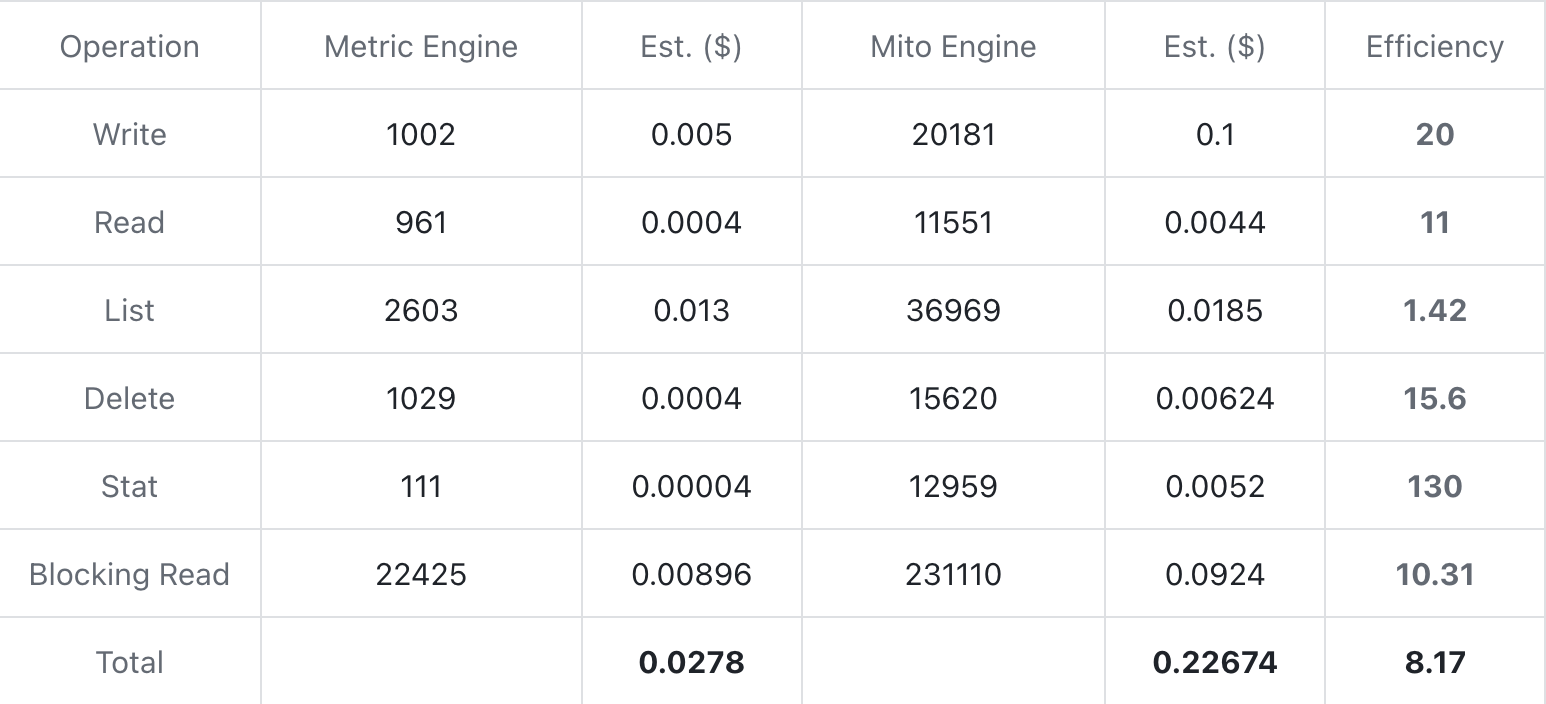
From the test data provided, it is evident that the Metric Engine can significantly reduce storage costs by decreasing the number of physical tables. The number of operations at each stage has seen a dramatic reduction, scaling down by an order of magnitude, which in turn has led to an overall cost reduction exceeding eight times.
Inverted Index
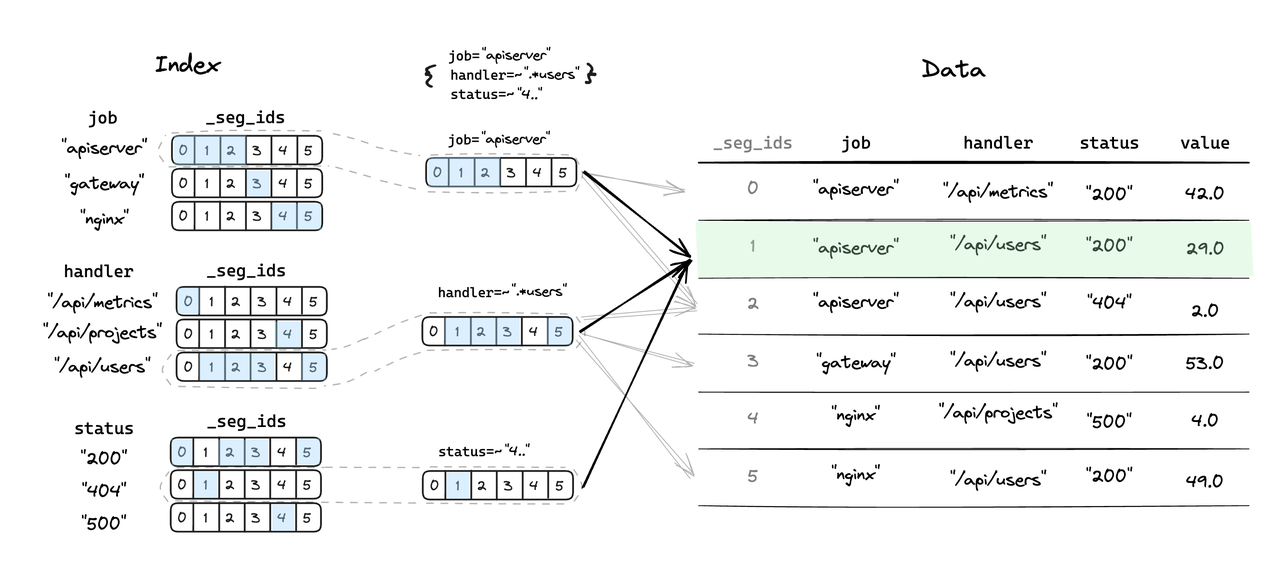
Inverted Index, as a newly introduced index module, is designed to pinpoint the data segments pertinent to user queries with high efficiency, significantly reducing the I/O operations required to scan data files, thereby accelerating the query process. In the context of TSBS testing scenarios, we observed an average performance increase of 50%, with select scenarios experiencing boosts of up to nearly 200%.
The advantages of the Inverted Index include:
Ready to use: The system can automatically generate appropriate indexes, no need for users to specify manually.
Practical functionality: Supports equality, range, and regular expression matches for multiple column values, ensuring rapid data location and filtering in most scenarios.
Flexible adaptation: It automatically fine-tunes internal parameters to strike an optimal balance between the cost of construction and the efficiency of queries, adeptly catering to the diverse indexing requirements of different use cases.
Other Updates
- Database management capabilities significantly enhanced
We have substantially supplemented the information_schema tables, adding information such as SCHEMATA and PARTITIONS.
Besides, we also introduced many new SQL functions to facilitate management operations on GreptimeDB. For example, it is now possible to trigger Region Flush and perform Region migration through SQL, as well as to query the execution status of procedures.
- Performance Improvement
In v0.7, the Memtable was restructured and upgraded, enhancing data scan speed and reducing memory usage. At the same time, we have made numerous improvements and optimizations to the read and write performance of object storage.
Upgrade Guide
As we have many significant changes in the new version, the release of v0.7 requires a system downtime upgrade. It is recommended to use the official upgrade tool, with the general upgrade process as follows:
- Create a brand new v0.7 cluster
- Shut down the traffic entry to the old cluster (stop writing)
- Export the table structure and data using the GreptimeDB CLI upgrade tool
- Import the data into the new cluster using the GreptimeDB CLI upgrade tool
- Switch the traffic entry to the new cluster
Please refer to the detailed upgrade guide here.
Future Plan
Our next milestone is scheduled for April, as we anticipate the launch of v0.8. This release will mark the completion of GreptimeFlow, a streamlined stream computing solution adept at conducting continuous aggregation across GreptimeDB data streams. Designed with flexibility in mind, GreptimeFlow can either be integrated directly into the GreptimeDB Frontend or deployed as a standalone service within the GreptimeDB architecture.
Beyond continual functional upgrades, we are persistently optimizing GreptimeDB's performance. Although v0.7 has seen substantial enhancements in performance compared to its predecessors, there remains a gap in observability scenarios compared to some mainstream solutions. Bridging this performance gap will be our primary focus in the upcoming optimization efforts.
For a comprehensive view of our planned version updates, we invite you to explore the GreptimeDB 2024 roadmap. Stay connected and journey with us as we continue to evolve GreptimeDB.
About Greptime
Greptime offers industry-leading time series database products and solutions to empower IoT and Observability scenarios, enabling enterprises to uncover valuable insights from their data with less time, complexity, and cost.
GreptimeDB is an open-source, high-performance time-series database offering unified storage and analysis for metrics, logs, and events. Try it out instantly with GreptimeCloud, a fully-managed DBaaS solution—no deployment needed!
The Edge-Cloud Integrated Solution combines multimodal edge databases with cloud-based GreptimeDB to optimize IoT edge scenarios, cutting costs while boosting data performance.
Star us on GitHub or join GreptimeDB Community on Slack to get connected.

