Summary
Together with our global community of contributors, GreptimeDB continues to evolve and flourish as a growing open-source project. We are grateful to each and every one of you.
Below are the highlights among recent commits:
- The
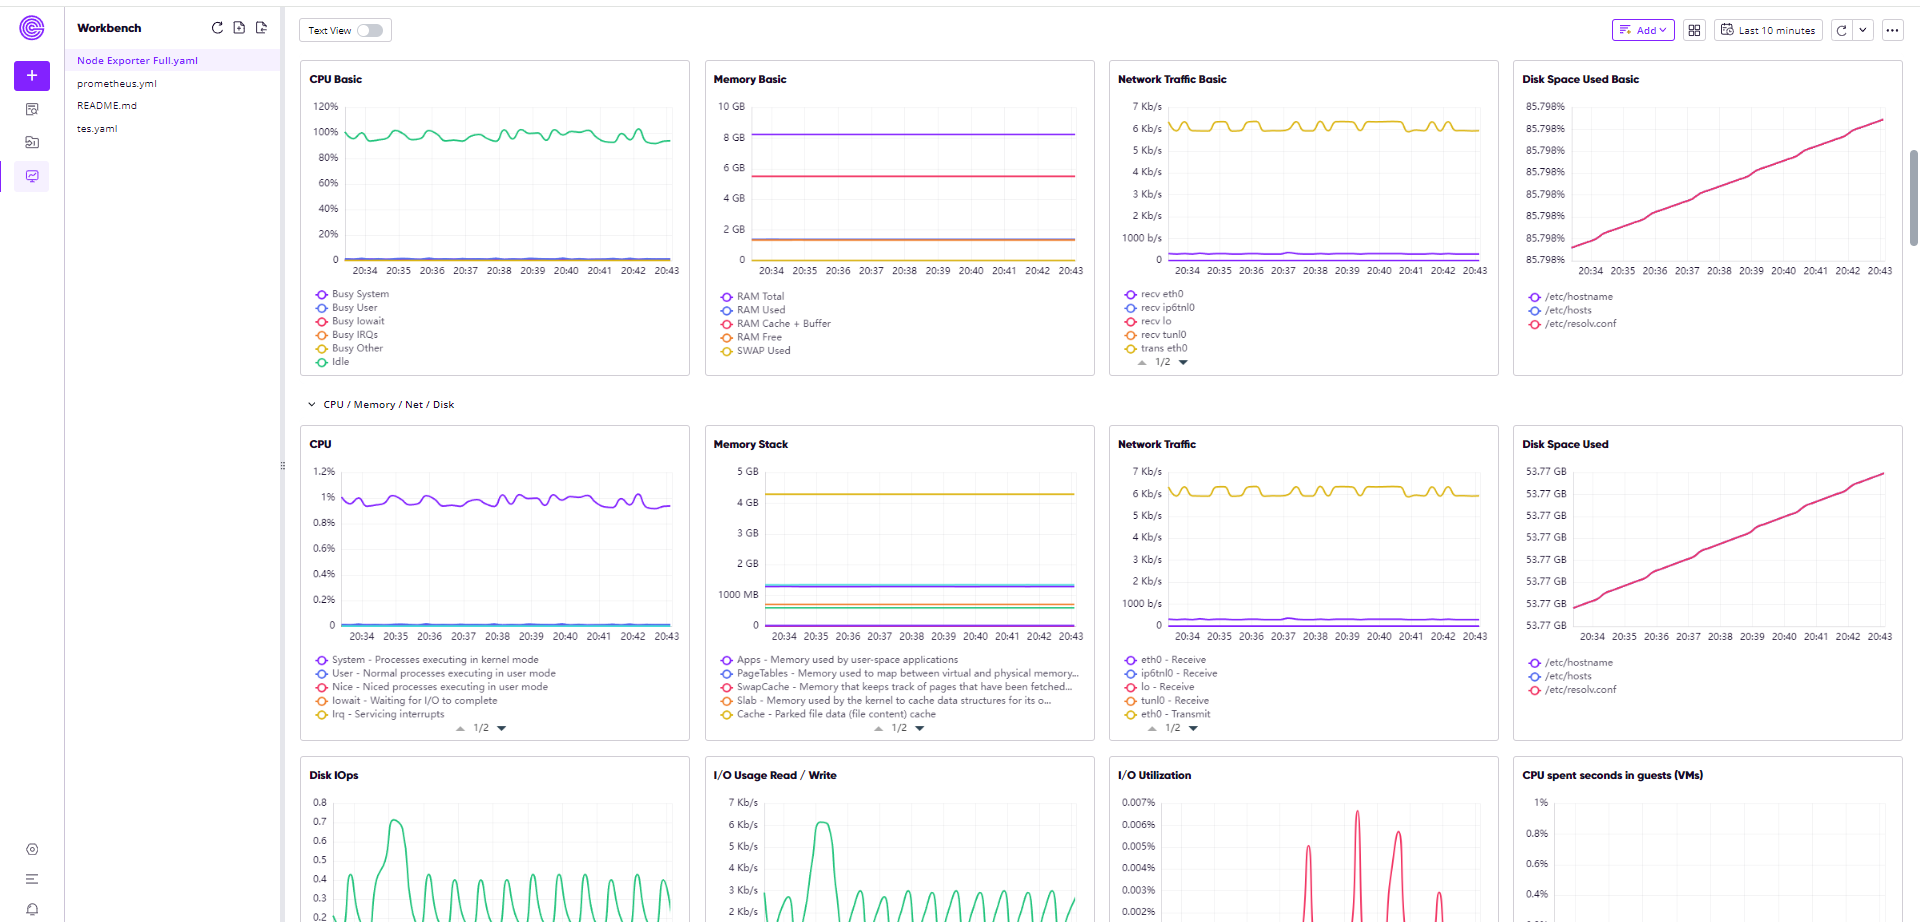
scalar()function of PromQL has been implemented. GreptimeDB now fully supports the node-exporter Grafana dashboard (individual metric calibrations are still in progress).

It supports specifying the Prometheus protocol's
lookbackparameter during queries. This parameter can control the time range for point selection (lookback) during an instant query, which is particularly useful for querying data with different scrape intervals.Compatibility has been added for SQL types
TINYTEXT,MEDIUMTEXT, andLONGTEXT. Some external tools, such as Apache SkyWalking, require these types.
Contributors
For the past two weeks, our community has been super active with a total of 54 PRs merged. 9 PRs from 5 individual contributors merged successfully and lots pending to be merged.
Congrats on becoming our most active contributors in the past 2 weeks:
👏 Welcome contributor @irenjj join to the community as the new individual contributor, and congratulations on successfully merging their first PR, more PRs are waiting to be merged.

A big THANK YOU to all our members and contributors! It is people like you who are making GreptimeDB a great product. Let's build an even greater community together.
Highlights of Recent PRs
#3693 Added support for PromQL's scalar() function
The
scalar()function is designed to transform an instant vector into a scalar value.This function is crucial for certain Grafana dashboards, such as the node-exporter dashboard, which utilizes it to calculate the average CPU load using the PromQL:
scalar(node_load1{instance="node-exporter:9100",job="node"}) * 100
/
count(
    count by (cpu) (node_cpu_seconds_total{instance="node-exporter:9100",job="node"})
)
#3630 Added capability to specify the lookback parameter for Prometheus protocol during queries, with a default setting of 5 minutes
The
lookbacksetting determines the time range for selecting data points in a PromQL instant query.If the data collection interval is longer than 5 minutes, the default
lookbacksetting may result in no data points being selected.This parameter was previously non-configurable; however, it can now be adjusted as follows:
Include the
lookbackparameter in the Prometheus query HTTP API.In SQL interface queries of PromQL, insert the
lookbackparameter using syntax:TQL EVAL (<start>, <end>, <step>, [lookback]) <promql>.
For example, the data collection precision is set at 10 minutes:
CREATE TABLE test(i DOUBLE, j TIMESTAMP TIME INDEX, k STRING PRIMARY KEY);

INSERT INTO test VALUES (1, 1713888001000, "a"), (2, 1713888601000, "a");
When using the default lookback parameter:
TQL EVAL (1713888400, 1713888520, '60s') test;The query results are empty:
Empty setIf the lookback is set to 10 minutes:
TQL EVAL (1713888400, 1713888520, '60s', '10m') test;Results can be successfully retrieved:
+------+---------------------+------+
| i    | j                   | k    |
+------+---------------------+------+
|    1 | 2024-04-23 16:06:40 | a    |
|    1 | 2024-04-23 16:07:40 | a    |
|    1 | 2024-04-23 16:08:40 | a    |
+------+---------------------+------+
3 rows in set
#3731 Ensured compatibility with SQL data types TINYTEXT,MEDIUMTEXT, and LONGTEXT
These types are often required for integration with external tools, such as Apache SkyWalking. When creating tables, these data types can now be specified, mapping directly to GreptimeDB's string type.
#3638 Introduced the is_strict_mode parameter for strict UTF-8 validation of strings written via the Prometheus protocol
Due to performance considerations, this parameter is disabled by default. To check if the data being written contains illegal UTF-8 characters, you can set this parameter to true.
Specific method: To enable this check, set
is_strict_modeto true in the[http]section of the configuration file.
#3684 Resolved an issue with the CLI tool when exporting tables with names that include .
Previously, errors might occur if table names contained ., such as a.b.c.d, especially during data export using the CLI tool. Example export command: greptime cli export --addr '127.0.0.1:4001' --output-dir /tmp/greptimedb-export --target create-table.
#3722 Addressed the problem of not accounting for the memory usage of NULL values during data writing
Previously, if data written by users consisted of a large proportion of NULL values, GreptimeDB might not flush on time, resulting in excessive memory usage.
Good First Issue
#3336 Added TLS support for GreptimeDB's gRPC service
Currently, GreptimeDB's gRPC service does not support encryption. Adding TLS protocol support will enhance the security when using the gRPC protocol.
Keywords: gRPC, TLS, security
Difficulty: medium
#3511 Supported specifying a time range in COPY FROM statements to avoid importing unnecessary data
COPY FROM statements are often used to restore table data from backup files. Supporting the filtering of specific time ranges can avoid importing unnecessary data and speed up data recovery.
Keywords: backup/recovery, filtering, timestamp
Difficulty: medium
#3597 Migrated from orc-rs to datafusion-orc
The crate orc-rs is no longer maintained, necessitating the migration of dependencies to the alternative crate datafusion-orc.
Keywords: dependency update
Difficulty: medium


