Overview of OpenTelemetry Instrumentation
This post covers the first major step in capturing observability data for your application: Instrumentation. If you are looking for an introduction to all of the components within OpenTelemetry and how they fit together, check out our previous blog post.
OpenTelemetry Instrumentation is done through the OpenTelemetry API, which the OpenTelemetry NodeJS SDK implements. These components hook into your codebase and produce the signals necessary to understand the state of your service.
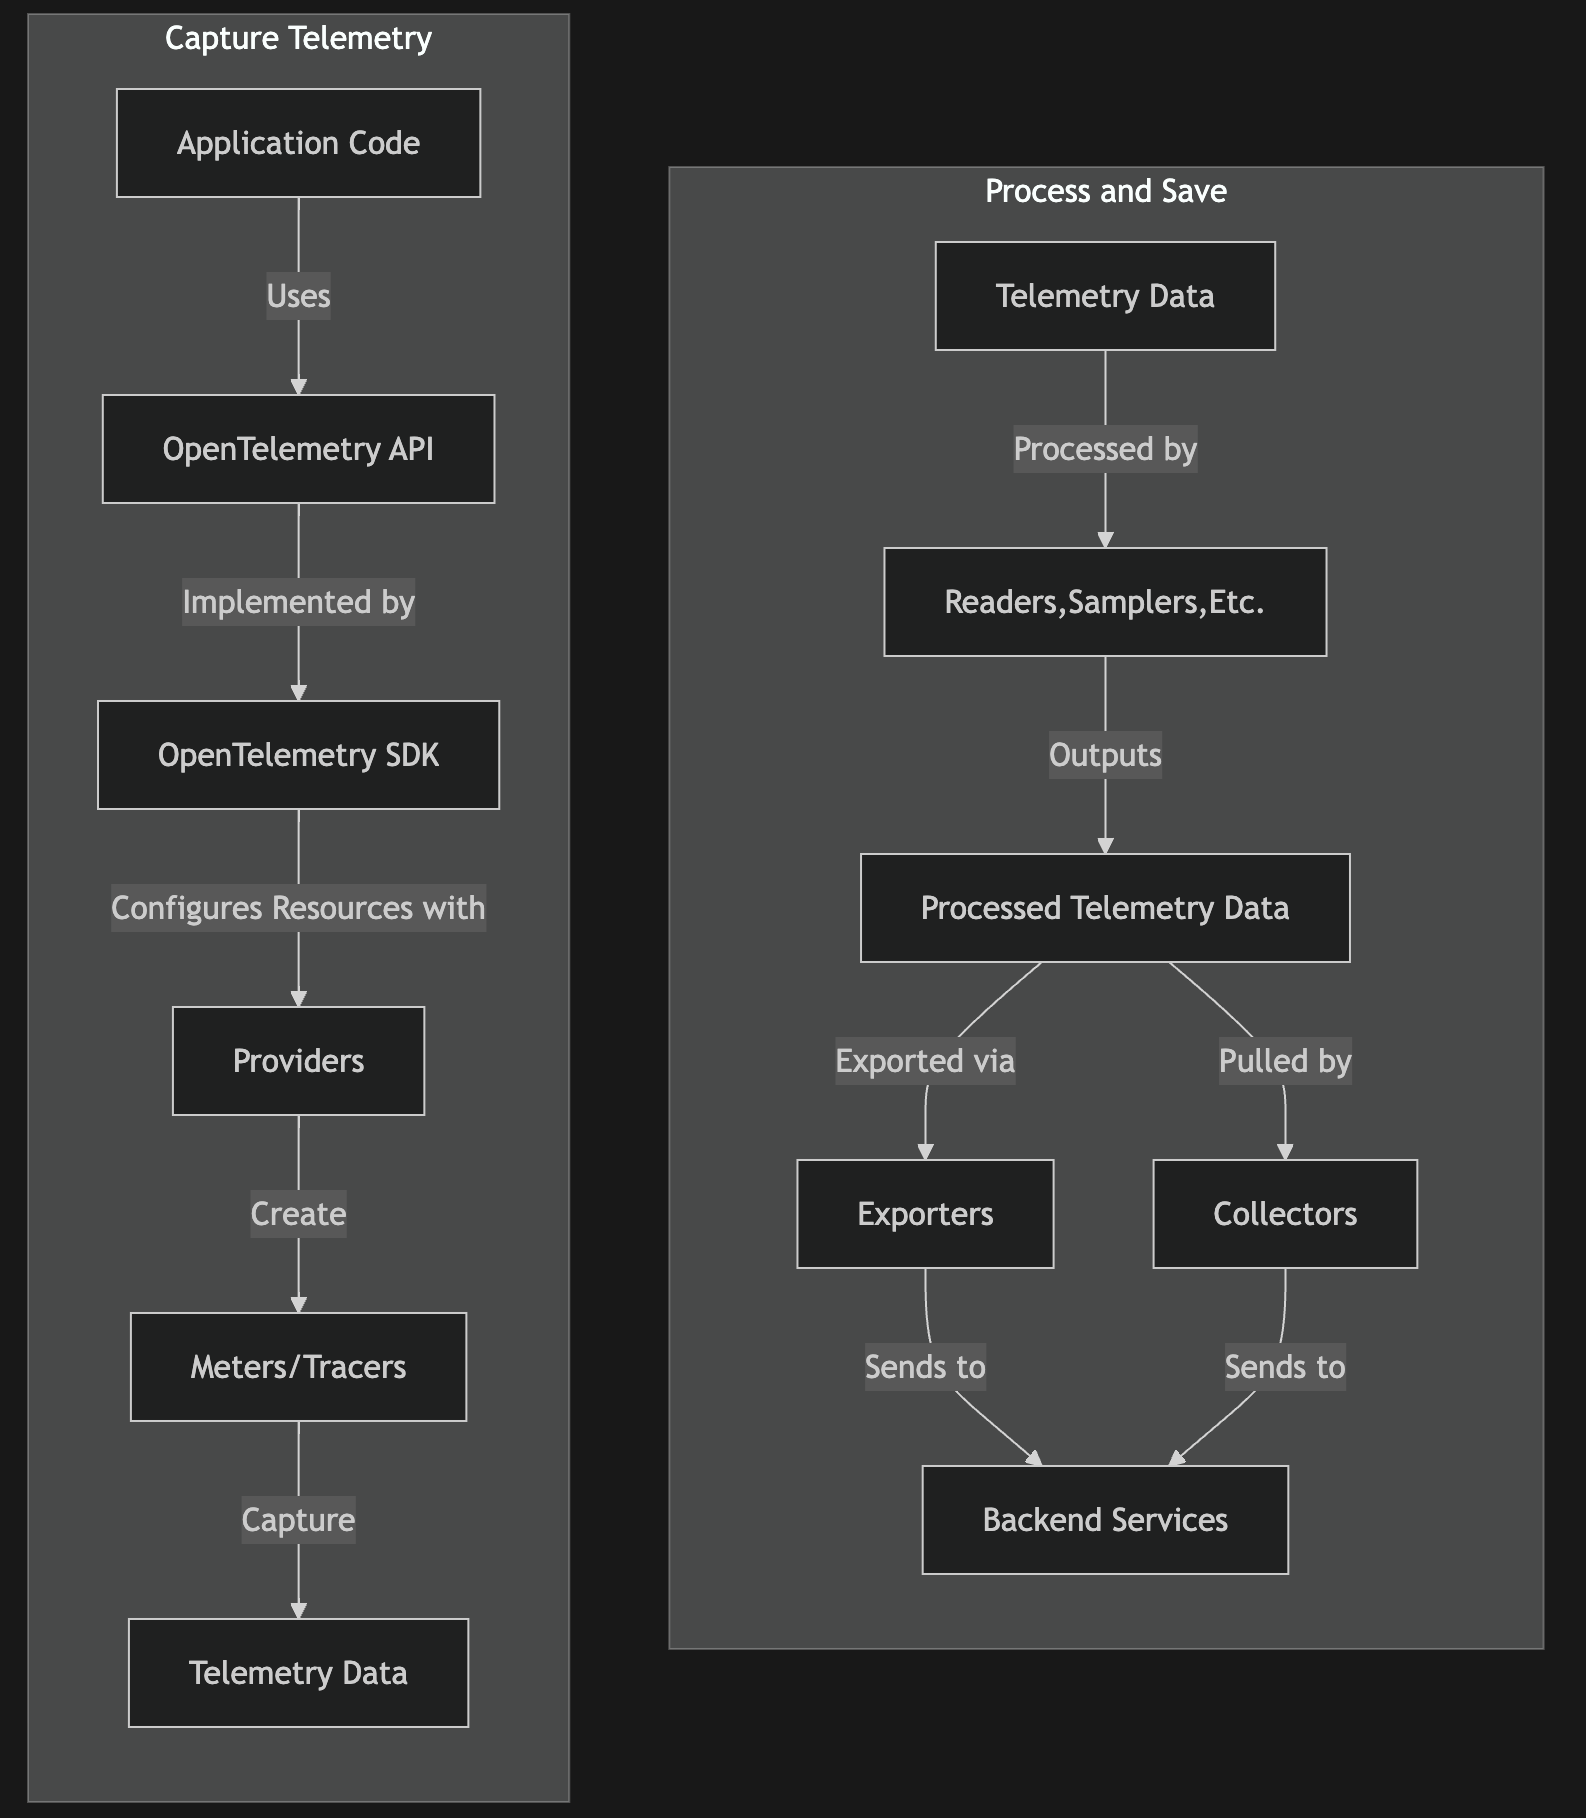
OpenTelemetry prioritizes modularity and flexibility with its component design that largely adheres to the single responsibility principle. There is a lot of terminology to keep track of, but the high level components are:
- Emit data with meters/tracers.
- Sample, filter, and transform data with readers/processors
- Package and transmit OTLP data to your chosen OTel compatible backend with exporters/collectors
This overview provides a solid foundation for thinking about application instrumentation. By understanding how data flows through these components, you'll be better equipped to instrument your own applications effectively.
OpenTelemetry Observability Data Flow
The main benefit to OpenTelemetry's design is that users can customize any part of their pipeline by adhering to the OTel API. These default implementations speak the OTel semantic language by emitting metrics and spans in a consistent way, and transmitting that data marshaled into the OpenTelemetry Protocol (OTLP) for consumption by OTLP backends that expect this format.
A visualization of how data flows through the components is shown below.

These standard operating procedures act as a guiding framework for Observability tools to conform to and give users of tools within this standard a wide selection to choose from. More detailed information can be found in the OpenTelemetry Specification
Now that we have a deeper understanding of the purpose the OTel API serves, and how data flows through it, let’s look into how to actually instrument an application. Instrumentation comes in two main classifications: Auto-Instrumentation and Hands-On Instrumentation. The next section goes through the differences between the two and when you might need one vs the other.
Auto-Instrumentation with OpenTelemetry
Auto-Instrumentation provides the easiest way to get started with OpenTelemetry. This process taps into well known interfaces at the edges of your applications and services. It automatically captures signals of some of the most common protocol operations by simply importing a library and instantiating a singleton, or in some frameworks and languages, just installing the SDK and exporting some environment variables.
Examples of common metrics you can capture through auto-instrumentation include:
- HTTP requests:
- Request duration
- Response status codes
- URL paths
- HTTP methods
- Database queries:
- Query execution time
- SQL statements (sanitized)
- Database type (e.g., MySQL, PostgreSQL)
- Messaging systems:
- Message publish/consume operations
- Queue names
- Message sizes
- Framework-specific signals:
- For web frameworks (e.g., Express.js, Flask):
- Route handling
- Middleware execution
- For web frameworks (e.g., Express.js, Flask):
- For ORMs (e.g., Sequelize, SQLAlchemy):
- Model operations (create, read, update, delete)
- Runtime metrics:
- CPU usage
- Memory allocation
- Garbage collection statistics
Below is an example express application that integrates the OpenTelemetry NodeJS SDK:
const express = require('express');
const { UserService } = require('./services/userService')

// ---------------------------------------------------
// ---------------------------------------------------
// ---------------------------------------------------
// Import the OpenTelemetry SDK
const { NodeSDK } = require('@opentelemetry/sdk-node');
const { getNodeAutoInstrumentations } = require('@opentelemetry/auto-instrumentations-node');
const { OTLPTraceExporter } = require('@opentelemetry/exporter-trace-otlp-http');

// Initialize the OpenTelemetry SDK
const sdk = new NodeSDK({
  traceExporter: new OTLPTraceExporter(),
  instrumentations: [getNodeAutoInstrumentations()]
 // sets up basic defaults for express http collection and app resource consumption
});

// Start the SDK
sdk.start();

// That's all the configuration needed to start collecting metrics
// ---------------------------------------------------
// ---------------------------------------------------
// ---------------------------------------------------


// Create and set up your Express app as usual
const app = express();

// Your routes and middleware here
app.get('/', (req, res) => {
  res.send('Hello, OpenTelemetry!');
});

app.listen(...);
These auto-instrumented signals provide a substantial baseline of observability data with minimal code update, making it easier to get started with OpenTelemetry. While this process certainly provides a lot of value with very little effort, often an application owner needs to listen for more customized signals happening within their application. Developers can implement manual instrumentation to achieve fine-grained control over the signals being emitted.
Manual Instrumentation
The main piece of this configuration lies within the provider, which serves as factories for creating objects that output signals. These factories are where you can configure objects like:
- resources: identify the entity producing the telemetry data. These typically include attributes like service names, host information, container or pod identifiers, cloud provider details, or other metadata that describe the source of the telemetry. Resources help to provide context about where the data is coming from.
- meters/tracers (e.g.
ObservableGauge) are the instruments actually capturing the metrics and traces. These are the objects that actually produce the telemetry data. - readers (e.g.
PeriodicExportingMetricReader) can be used to export metrics everynseconds. - samplers (e.g.
TraceIdRatioBasedSampler) can be used to capturer% of requests. - exporters (e.g.
OTLPTraceExporter) can be used to send data to an OTLP compatible backend like GreptimeCloud.
The below example shows how to set up manual instrumentation to collect data from a mock Tesla API about the car's battery level. This application uses the SDK to configure an OTLPExporter to send the metrics to the GreptimeCloud hosted OTLP backend.
const { MeterProvider } = require('@opentelemetry/sdk-metrics');
const { Resource } = require('@opentelemetry/resources');
const { SemanticResourceAttributes } = require('@opentelemetry/semantic-conventions');
const { NodeTracerProvider } = require('@opentelemetry/sdk-trace-node');
const { SimpleSpanProcessor, BatchSpanProcessor, ConsoleSpanExporter } = require('@opentelemetry/sdk-trace-base');
const { trace, metrics, context } = require('@opentelemetry/api');
const { OTLPMetricExporter } = require('@opentelemetry/exporter-metrics-otlp-http');
const { PeriodicExportingMetricReader } = require('@opentelemetry/sdk-metrics');
const teslajs = require('teslajs');
const options = {
  authToken: 'your-access-token',
  vehicleID: 'your-vehicle-id'
};
// Configure the resource naming the given service
const resource = new Resource({
  [SemanticResourceAttributes.SERVICE_NAME]: 'tesla-monitoring-app',
});

// Configure the exporter to be sent to GreptimeCloud
const otlpExporter = new OTLPMetricExporter({
  url: 'https://6qr5e68t5wpn.us-west-2.aws.greptime.cloud/v1/otlp/v1/metrics',
  headers: {
    'Authorization': 'Basic WxN5prHHwx1ATXMvduBlgy4K:xxxxxxx',
    'X-Greptime-DB-Name': 'my-greptime-cloud-instance@tesla-monitoring',
  },
});

// Set this MeterProvider to be global to the app being instrumented.
const meterProvider = new MeterProvider({ resource });
opentelemetry.metrics.setGlobalMeterProvider(meterProvider);
const metricReader = new PeriodicExportingMetricReader({
  exporter: otlpExporter,
  exportIntervalMillis:   exportIntervalMillis: 5 * 60 * 1000
});

meterProvider.addMetricReader(metricReader);

// Create and register the tracer
const tracerProvider = new NodeTracerProvider();

// Configure span processor to send spans to simply log the results
tracerProvider.addSpanProcessor(new BatchSpanProcessor(new ConsoleSpanExporter()));
tracerProvider.register();

const tracer = trace.getTracer('example-basic-tracer-node');

const teslaMeter = metrics.getMeter(
  "tesla-instrumentation",
  '1.0',
);

const batteryGauge = teslaMeter.createObservableGauge("tesla.battery");

async function pollTeslaData() {
  const span = tracer.startSpan('pollTeslaData');
  const ctx = trace.setSpan(context.active(), span);

  try {
    await context.with(ctx, async () => {
      const vehicleData = await teslajs.vehicleData()
vehicleData.charge_state.battery_level
      batteryGauge.addCallback((result) => {
        result.observe(batteryLevel);
      });
    });
  } catch (error) {
    span.recordException(error);
  } finally {
    span.end();
  }
}

// Poll Tesla data every 5 minutes
setInterval(pollTeslaData, 5 * 60 * 1000);
This above example displays the breadth of support within OpenTelemetry for capturing observability data and shows how easy it is to get started.
Using Data Captured from OpenTelemetry Instrumentation
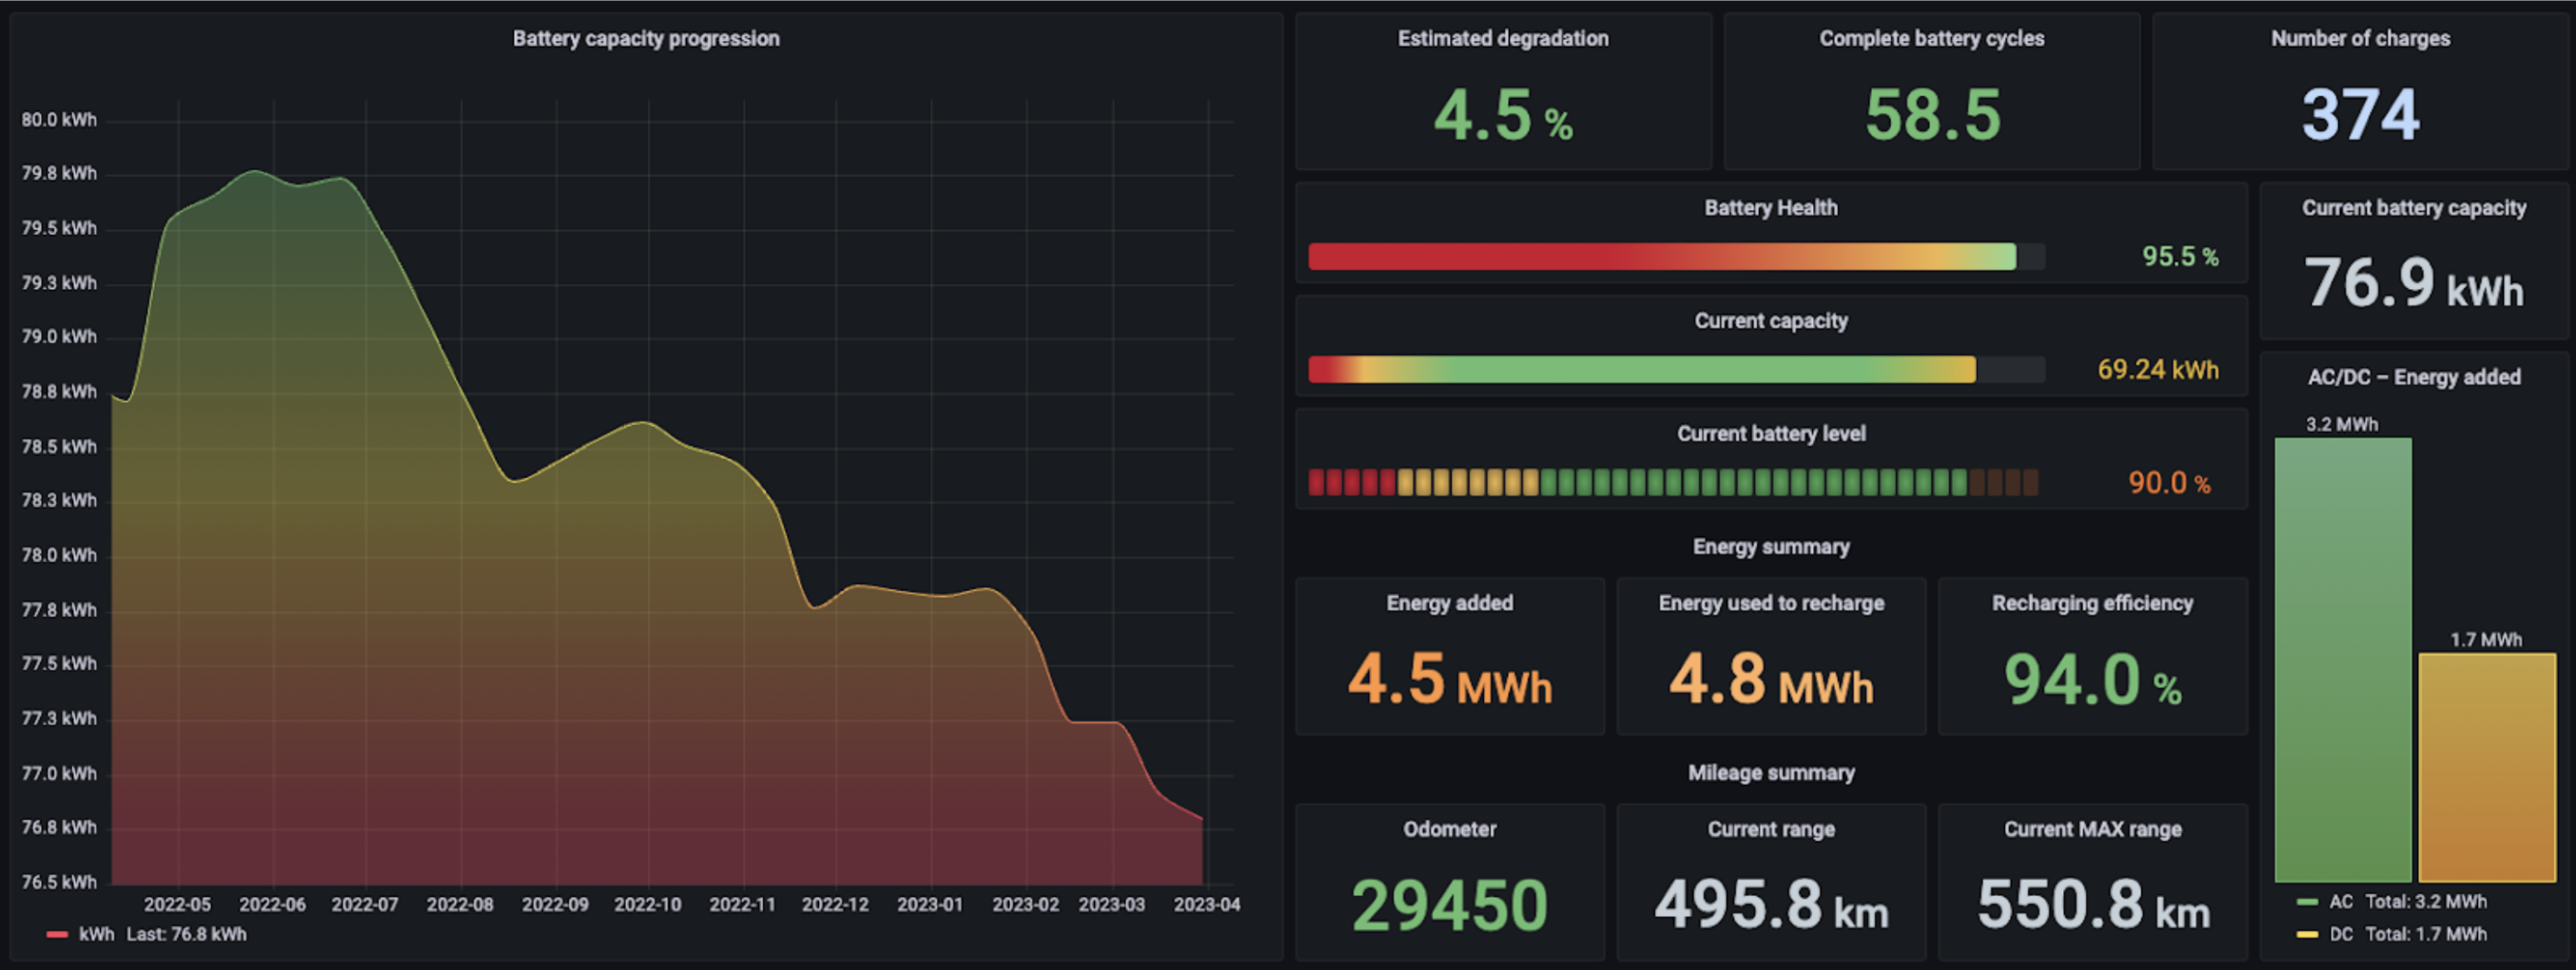
In future blogs, we will describe the process of connecting this OpenTelemetry data to reporting platforms, like Grafana, to visualize your data. If you are looking for an OpenTelemetry backend that is performant, reliable, and open source, check out GreptimeDB.

With GreptimeDB’s Grafana plugin, you can visualize all of the data you capture from OpenTelemetry directly in Grafana. Set up your GreptimeCloud instance in minutes and start using OpenTelemetry to deliver new insights for your service.
About Greptime
Greptime offers industry-leading time series database products and solutions to empower IoT and Observability scenarios, enabling enterprises to uncover valuable insights from their data with less time, complexity, and cost.
GreptimeDB is an open-source, high-performance time-series database offering unified storage and analysis for metrics, logs, and events. Try it out instantly with GreptimeCloud, a fully-managed DBaaS solution—no deployment needed!
The Edge-Cloud Integrated Solution combines multimodal edge databases with cloud-based GreptimeDB to optimize IoT edge scenarios, cutting costs while boosting data performance.
Star us on GitHub or join GreptimeDB Community on Slack to get connected.


