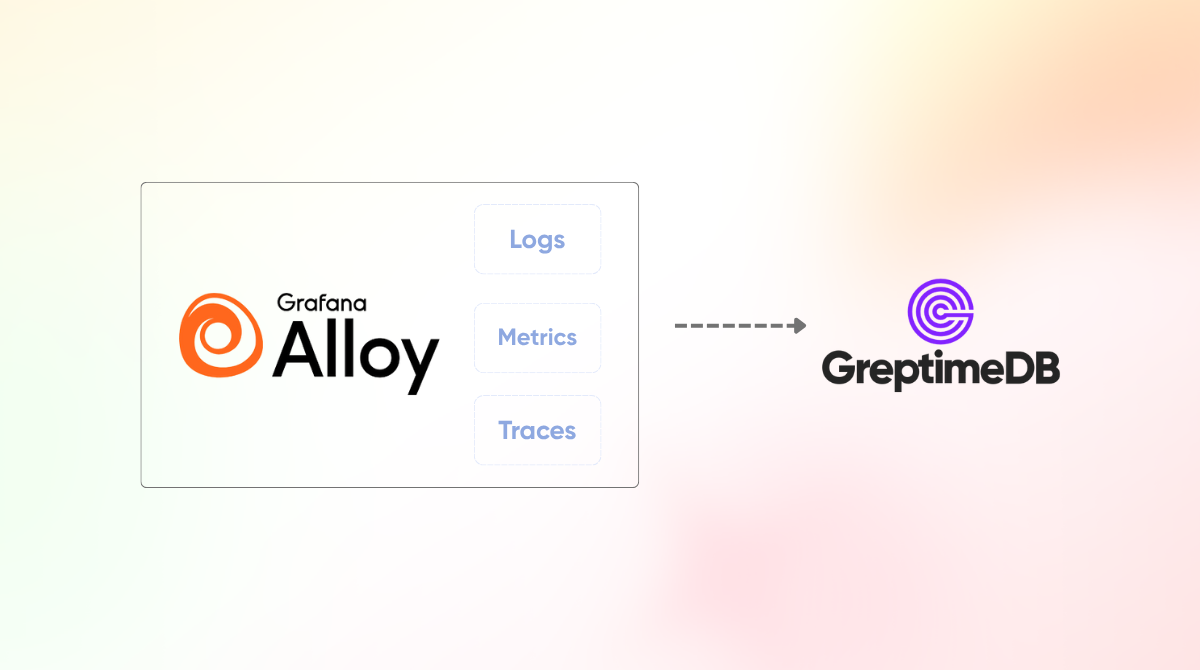
In this tutorial, we will cover how to use Grafana Alloy as the data source for GreptimeDB. Grafana Alloy is the successor of previous Grafana Agent, and it's also one of the most practical OpenTelemetry Collector distributions you can find on the market.
Grafana Alloy Intro
Alloy is a general-purpose collection of state-of-the-art telemetry data collectors. It has most features of OpenTelemetry Collector, which is able to receive and to send OTLP data from sources to sinks. It's also very practical to have a Prometheus agent built-in, so you can configure it to scrape metrics from /metrics endpoints, do some transformation like relabelling, and remote write to any sinks includes Prometheus remote-write compatible ones, and OpenTelemetry compatible ones.
These are a few useful components in Alloy:
- Prometheus scrape
- Prometheus relabel
- Prometheus remote write
- OpenTelemetry Collector Prometheus Receiver
- OpenTelemetry Collector Loki Receiver
- OpenTelemetry Collector Processors
- OpenTelemetry Collector Exporter OTLP/HTTP
- Loki writer
- Local file source
There are more of them you can find from Alloy's documentation.
Connect Alloy to GreptimeDB
Thanks to GreptimeDB's broad support of the observability ecosystem, you can use almost all exporters of Alloy, including Prometheus remote write, OpenTelemetry OTLP and Loki, to ingest data to GreptimeDB.
But in Practice, we have our own recommendations when you ingest different types of telemetry data.
Metrics
We recommend you to use Prometheus remote write for metrics ingestion in GreptimeDB because:
- Data written from PRW are more friendly, native to PromQL queries
- Because Prometheus Scraper is the typical data source, it saves you from format conversion
To configure GreptimeDB as PRW sink:
prometheus.remote_write "metrics_service" {
  endpoint {
    url = "${GREPTIME_SCHEME:=http}://${GREPTIME_HOST:=greptimedb}:${GREPTIME_PORT:=4000}/v1/prometheus/write?db=${GREPTIME_DB:=public}"

    basic_auth {
      username = "${GREPTIME_USERNAME}"
      password = "${GREPTIME_PASSWORD}"
    }
  }
}
We use substitute syntax for greptimedb endpoint information, replace it with your own setup.
And you can configure this component in forward_to section of Prometheus scrape or relabel component:
  forward_to = [
    prometheus.remote_write.metrics_service.receiver,
  ]
Logs
For log ingestion, GreptimeDB accepts both Loki protocol and OpenTelemetry OTLP/HTTP. It makes difference from the user perspective, so I will recommend you to follow your data source to avoid additional transformation. Both Loki and OpenTelemetry Collector has its own processing/transformation mechanism. Also note that with GreptimeDB you can do it within the database, too. So it's quite flexible depends on your pipeline topology and resource you want to spend in the database(greptimedb), or the agent(alloy).
An example of sending logs to Loki and OpenTelemetry sinks:
otelcol.auth.basic "credentials" {
  username = "${GREPTIME_USERNAME}"
  password = "${GREPTIME_PASSWORD}"
}

otelcol.exporter.otlphttp "greptimedb_logs" {
  client {
    endpoint = "${GREPTIME_SCHEME:=http}://${GREPTIME_HOST:=greptimedb}:${GREPTIME_PORT:=4000}/v1/otlp/"
    headers  = {
      "X-Greptime-DB-Name" = "${GREPTIME_DB:=public}",
      "x-greptime-log-table-name" = "alloy_meta_logs",
      "x-greptime-log-extract-keys" = "hostname",
    }
    auth     = otelcol.auth.basic.credentials.handler
  }
}

loki.write "greptime_loki" {
    endpoint {
        url = "${GREPTIME_SCHEME:=http}://${GREPTIME_HOST:=greptimedb}:${GREPTIME_PORT:=4000}/v1/loki/api/v1/push"
        headers  = {
          "X-Greptime-DB-Name" = "${GREPTIME_DB:=public}",
          "X-Greptime-Log-Table-Name" = "${GREPTIME_LOG_TABLE_NAME:=loki_demo_logs}",
        }
    }
    external_labels = {
        "job" = "greptime",
        "from" = "alloy",
    }
}
To use these sinks, configure them to the output or write_to attribute of sources or processors.
Traces
The OpenTelemetry Collector is almost the de-facto standard of trace transportation. So just configure the source and sink with otelcol receiver and exporter.
Conclusion
We walked through all the important features of Grafana Alloy as an agent or collector for GreptimeDB. To see the full demo of Alloy and GreptimeDB, head to this repo. You can run it by yourself. In the demo, we will collect metrics and logs from Alloy agent itself to send to GreptimeDB in OTLP, Prometheus as well as Loki protocols.


