On this page
GreptimeDB Enterprise is the commercial version of GreptimeDB. It's designed to serve enterprise scenarios where users are facing critical challenges on data scalability, data processing and query management, reliability and enterprise adoption.
In this article, we will walk through key features that included GreptimeDB Enterprise 25.05.
Elasticsearch/Kibana Compatibility
A big amount of our user base for logs come from the Elasticsearch ecosystem. By switching to GreptimeDB, the user will benefit from more efficient data storage, better scalability and better performance on both ingestion and query. However, the legacy application and user-interface may slowdown the migration.
To address this issue, we developed a compatibility layer in GreptimeDB Enterprise for Elasticsearch. This layer allows user to configure GreptimeDB Enterprise as the backend of Kibana UI, for log search, aggregation and dashboard.
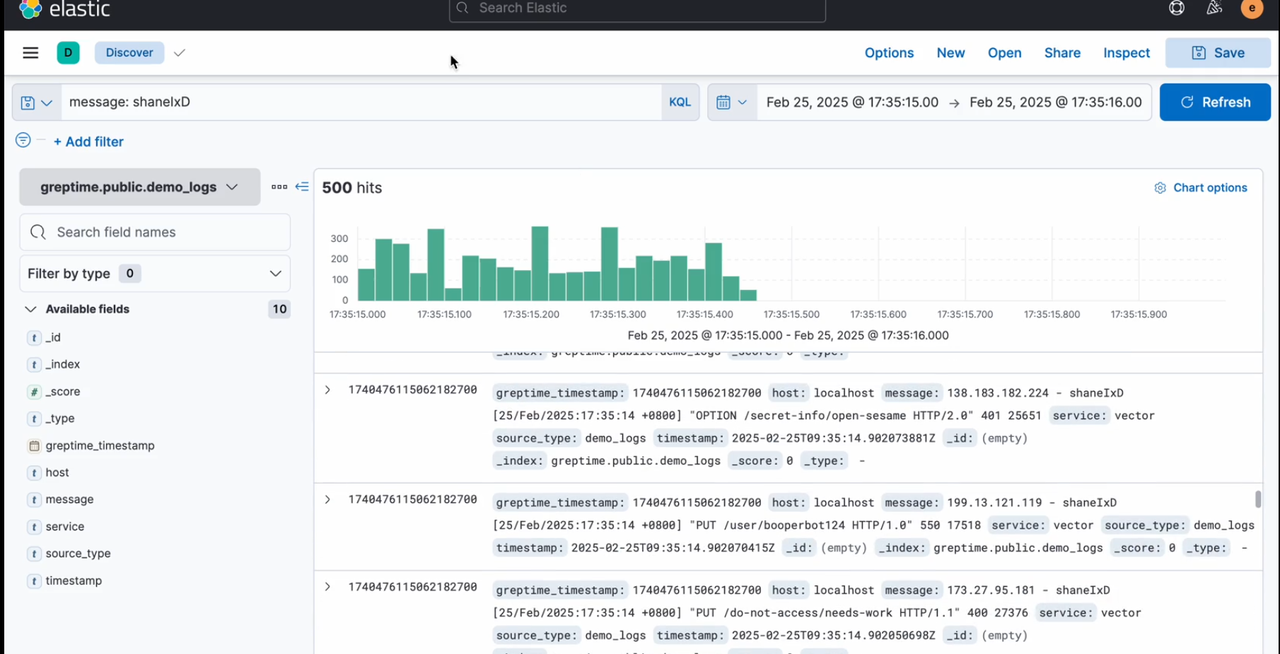
Elasticsearch queries supported in this release:
matchmatch_allmulti_matchtermtermsprefixwildcardregexprangeexistsbool
Read Replicas
In GreptimeDB OSS, for a particular partition, both read and write workloads are on the same datanode. This works great for typical real-time workloads: high-throughput ingestion, reading the latest data for dashboard and alerting system. However, when it comes to analytical query, which can involve a large range of data, this type of hybrid topology may affect each other. It also blocks us from using the maximum compute resource to speed up analytical query. In our raw-data based Observability 2.0 era, we relies on these type of queries to explore "unknown unknown". So a flexible resource management of query processing becomes important.
Thanks to our compute-storage disaggregated architecture, it's not a huge refactoring to add read replicas to current architecture. A new type of datanodes will play the role. It's dedicated to process query workloads. Because data are available on object storage, there will be no data replication between these types of datanodes and those original ones who take writes. User will be able to add hint to their queries to specify whether the query should run on read replicas.
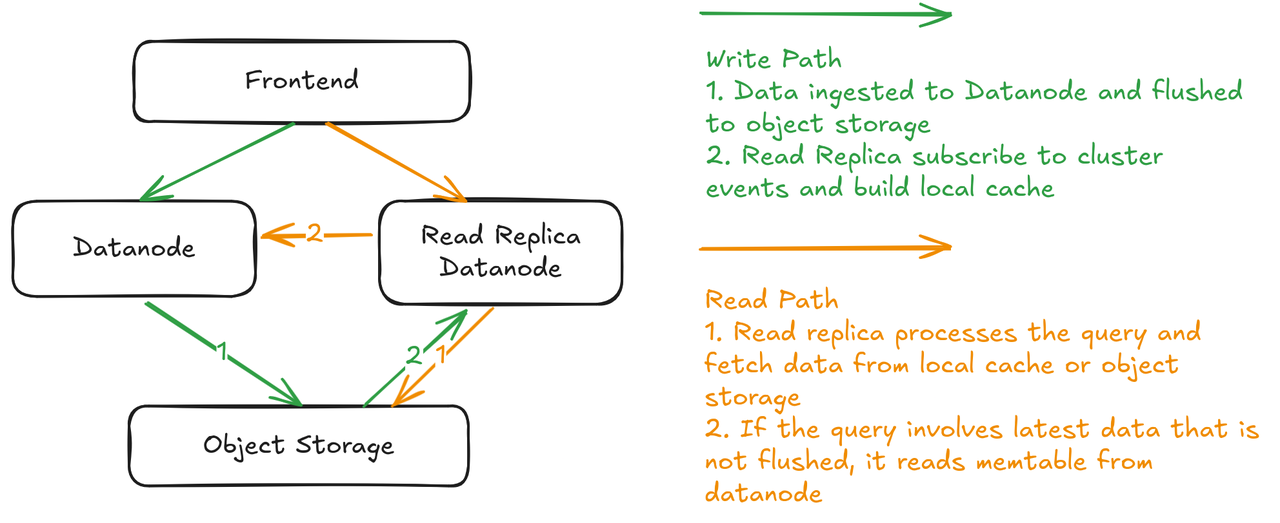
Read replicas can be long-running "warm" datanodes that subscribe to cluster events and build cache ahead of time. In next release, it can also be elastic and "cold", provisioned to respond particular queries.
Triggers
A few users asked about a built-in hook mechanism in GreptimeDB and trigger is our answer for that. This is the initial version of triggers. You define rules and notification hook that will be invoked when rule matches. Of course we designed it to work with Prometheus AlertManager.
A typical trigger definition:
sql
CREATE TRIGGER IF NOT EXISTS cpu_monitor
    ON (SELECT host AS host_label, cpu, memory FROM machine_monitor WHERE cpu > 1)
        EVERY '5 minute'::INTERVAL
    LABELS (severity = 'warning')
    ANNOTATIONS (summary = 'CPU utilization is too high', link = 'http://...')
    NOTIFY(
        WEBHOOK alert_manager URL 'http://127.0.0.1:9093' WITH (timeout="1m")
    );
Flow Reliability
Reliability features are added to flow, our light-weighted streaming engine:
- Task migration: move tasks between flow nodes for load balancing.
Conclusion
Our Enterprise Dashboard UI receives constant updates as well.
Our major release happens every 6 months. Minor features and bugfixes are delivered on-demand to our enterprise users.
Reach out with us for more information about enterprise offering, including features and advanced support.


