On this page
Background
OceanBase, launched in 2010, is a natively distributed database independently developed by Ant Group. Its unified architecture combines distributed scalability with centralized performance, delivers full Oracle/MySQL compatibility, supports diverse workloads including Transaction Processing (TP) and real-time Analytical Processing (AP), and natively integrates vector search and multi-modal data hybrid search capabilities, serving more than 4,000 customers across industries, including Financial Services, Telecom, Retail, Internet, and more.
In 2022, OceanBase launched its cloud database service, OB Cloud, to help customers build modern data architectures and simplify their tech stack with an integrated cloud database architecture. Operating across 240+ availability zones in 60+ regions across 16 countries and regions, OB Cloud is the only integrated cloud database with native presence on all 7 major public clouds globally — including Alibaba Cloud, Huawei Cloud, Tencent Cloud, Baidu Cloud, AWS, Azure, and Google Cloud — providing consistent global performance and supporting cross-region and cross-cloud active-active disaster recovery to meet diverse business growth needs.
One year after OB Cloud cut over from Grafana Loki to GreptimeDB, the platform now runs 80+ GreptimeDB clusters, holds 300 TB of log and SQL audit data, and has cut overall log storage cost by more than 60%.
What OB Cloud Stores in Logs
OB Cloud generates four kinds of logs that need to be stored, searchable, and retained for troubleshooting:
| Log type | What it is | Characteristics |
|---|---|---|
| Application logs | OB Cloud platform service logs | High volume, complex structure; used to debug platform issues |
| OBServer logs | OceanBase database kernel logs | High volume; used to debug kernel issues |
| OBProxy logs | OceanBase proxy logs | High volume; used to debug data-access issues |
| SQL audit | SQL execution audit records | High volume, high-frequency writes, uniform schema, complex SQL fields, strong query and analysis demand |
A defining property of these logs is that 95% of the time they are not queried. They have to be available the moment something goes wrong, but day-to-day they sit untouched. This shaped OB Cloud's priorities: the storage layer needs to absorb sustained write throughput at low cost per byte, while still answering keyword and structured queries quickly when an engineer actually needs them.
The Multi-Cloud Selection Journey
Starting with Aliyun SLS
OB Cloud's first stop was Alibaba Cloud's Simple Log Service (SLS). SLS is well-integrated into the Alibaba Cloud ecosystem, indexes log content with millisecond-level query response, and auto-scales without capacity management. The downsides made it a non-starter for OB Cloud: full indexing inflates storage cost, and SLS only runs inside Alibaba Cloud.
Looking at Each Cloud's Native Logging
Each cloud ships its own logging stack. The OB Cloud team surveyed all of them:
| Cloud | Collection agent | Query language |
|---|---|---|
| Alibaba Cloud SLS | Logtail (LoongCollector) | Lucene + standard SQL |
| Huawei Cloud LTS | ICAgent | Lucene-like |
| Tencent Cloud CLS | LogListener | Lucene-like |
| Baidu Cloud BLS | LogAgent | Lucene-like + standard SQL |
| AWS CloudWatch Logs | Unified CloudWatch Agent | Logs Insights |
| Azure Monitor Logs | Azure Monitor Agent (AMA) | KQL |
| GCP Logging | Ops Agent / Fluent Bit | Logging Query Language |
The fragmentation drives real cost on both sides:
- Engineering: every new cloud means another adapter — different query syntax, a different agent, a different collection convention, parallel whitelist and config setups. Building a unified abstraction over seven different backends is hard to maintain.
- Latency and price: CloudWatch Logs has visible delay (tens of seconds to minutes), CloudWatch charges per scanned data per query, SLS index traffic is expensive, and Azure storage is expensive.
Multi-Cloud-Neutral Storage
OB Cloud then evaluated multi-cloud-neutral options:
- Elasticsearch: mature, but operationally heavy with high storage cost.
- ClickHouse: had production cases, operationally heavy, high storage cost, no production-ready full-text index at the time of evaluation.
- Grafana Loki: had production cases, indexed by labels, supported object storage, low storage cost.
Loki, inspired by Prometheus, indexes only labels (not log content), supports S3 / OSS / GCS, queries via LogQL, and deploys natively on Kubernetes. OB Cloud picked it as the first generation.
First Generation: Logs on Loki
The Loki-based architecture looked like this:
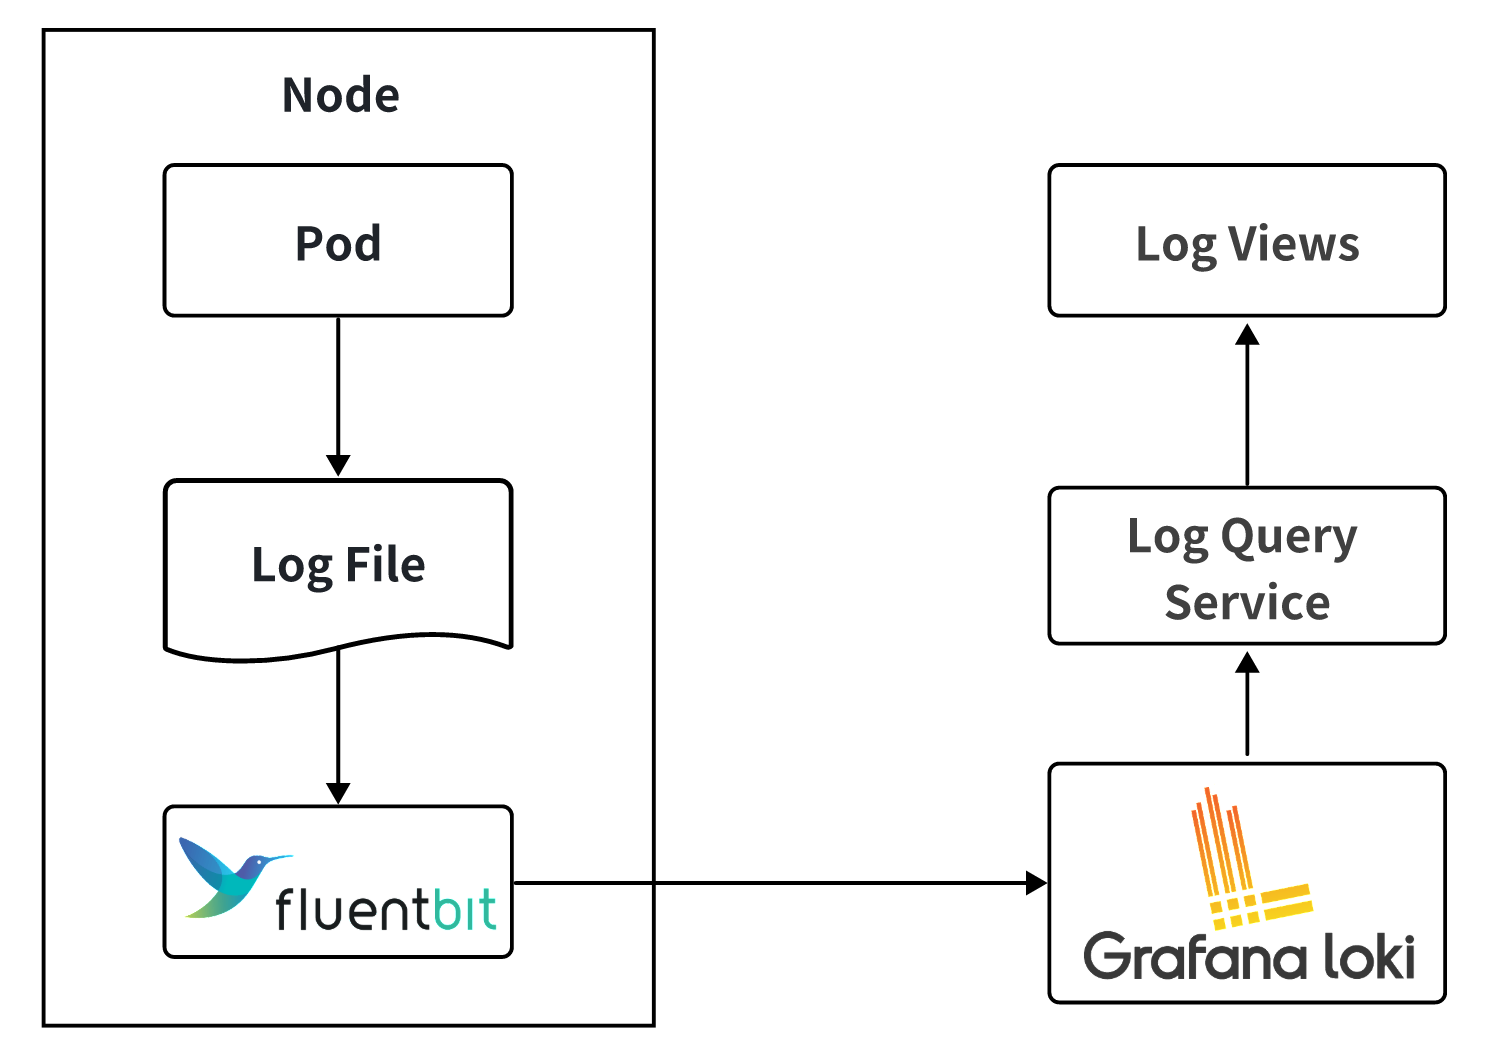
Fluent Bit on each node tailed pod logs and shipped them to Loki. The log viewer drove a query service that translated UI filters into LogQL and called Loki's API.
As volume grew, three limits surfaced:
- Index limited to labels. Searching log body content required brute-force scans.
- Large queries timed out. The viewer had to default the time range to a few minutes to keep responses tolerable.
- The bottleneck got worse, not better, as workload grew, and engineers' debugging cycles stretched out.
Switching to GreptimeDB
GreptimeDB matched what OB Cloud needed in the v0.12 POC:
- Cloud-native: separation of compute and storage, K8s-native deploy and ops.
- Object storage: native support for S3 / OSS / GCS / ABS.
- High compression: columnar storage with efficient compression keeps cost low.
- Unified interface: SQL queries plus a unified write protocol — same client experience across clouds.
- Rich indexes: full-text plus inverted indexes accelerate keyword search beyond brute-force scan.
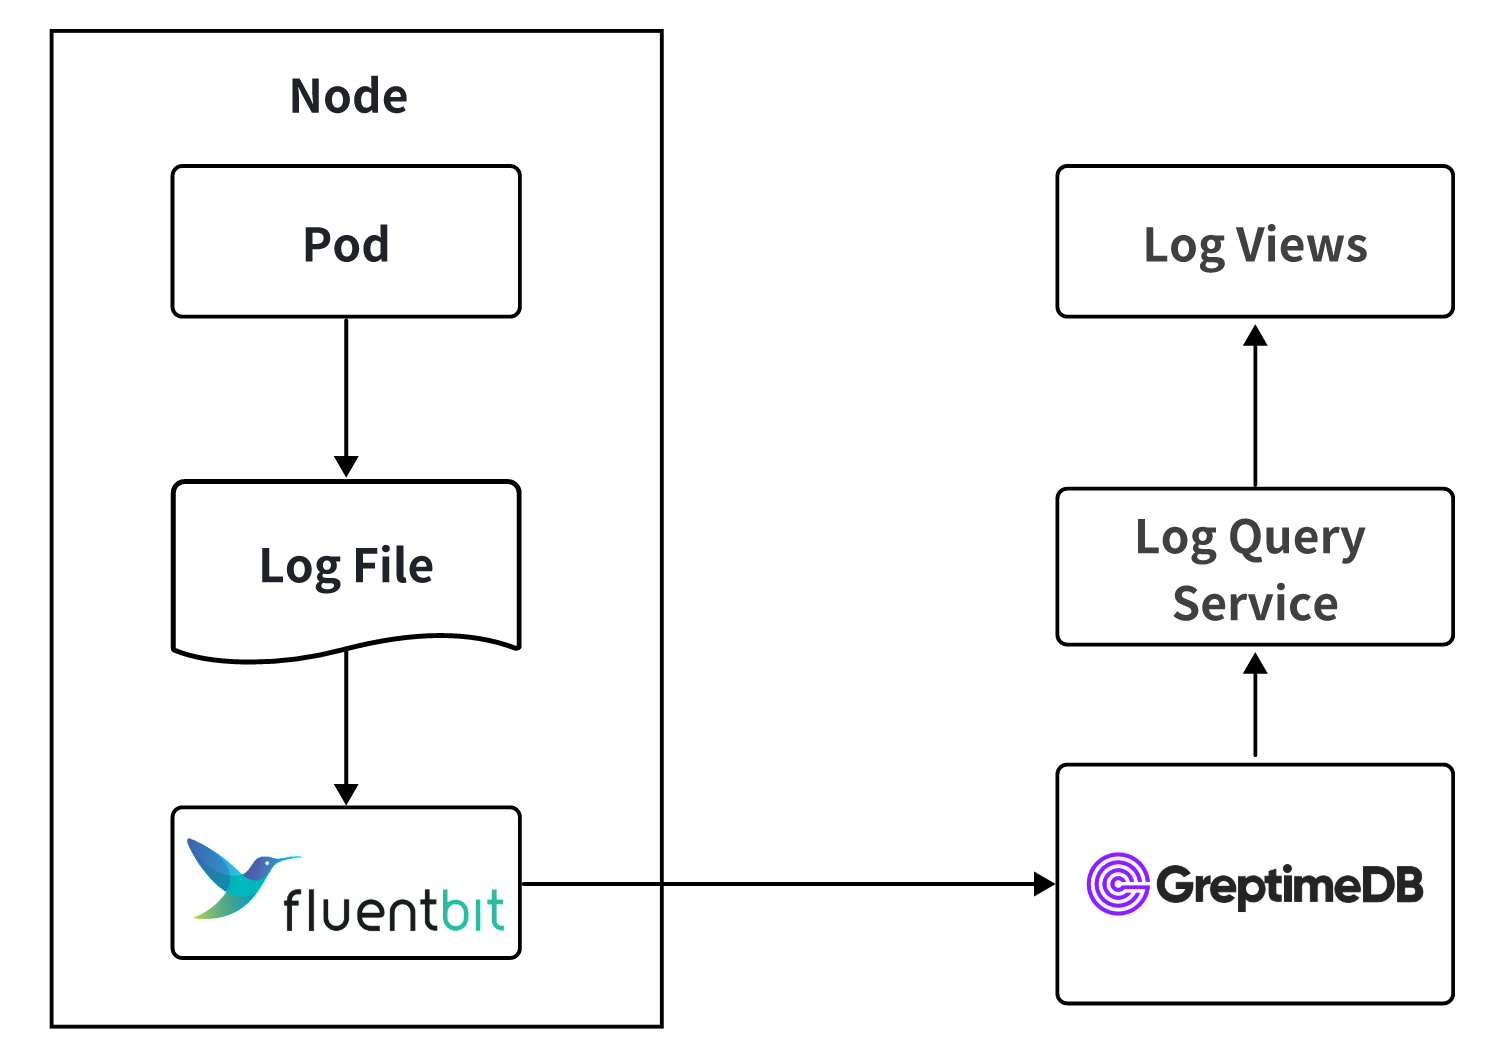
After validating these on real workloads, OB Cloud cut over: Fluent Bit writes directly to GreptimeDB, and the query service uses GreptimeDB's SQL interface. Queries that previously timed out on Loki now return in sub-second to single-second latency, and the viewer's default time range went from minutes to hours and days.
Multi-Cloud Deployment
OB Cloud runs a dedicated GreptimeDB cluster in each cloud, backed by that cloud's native object storage:
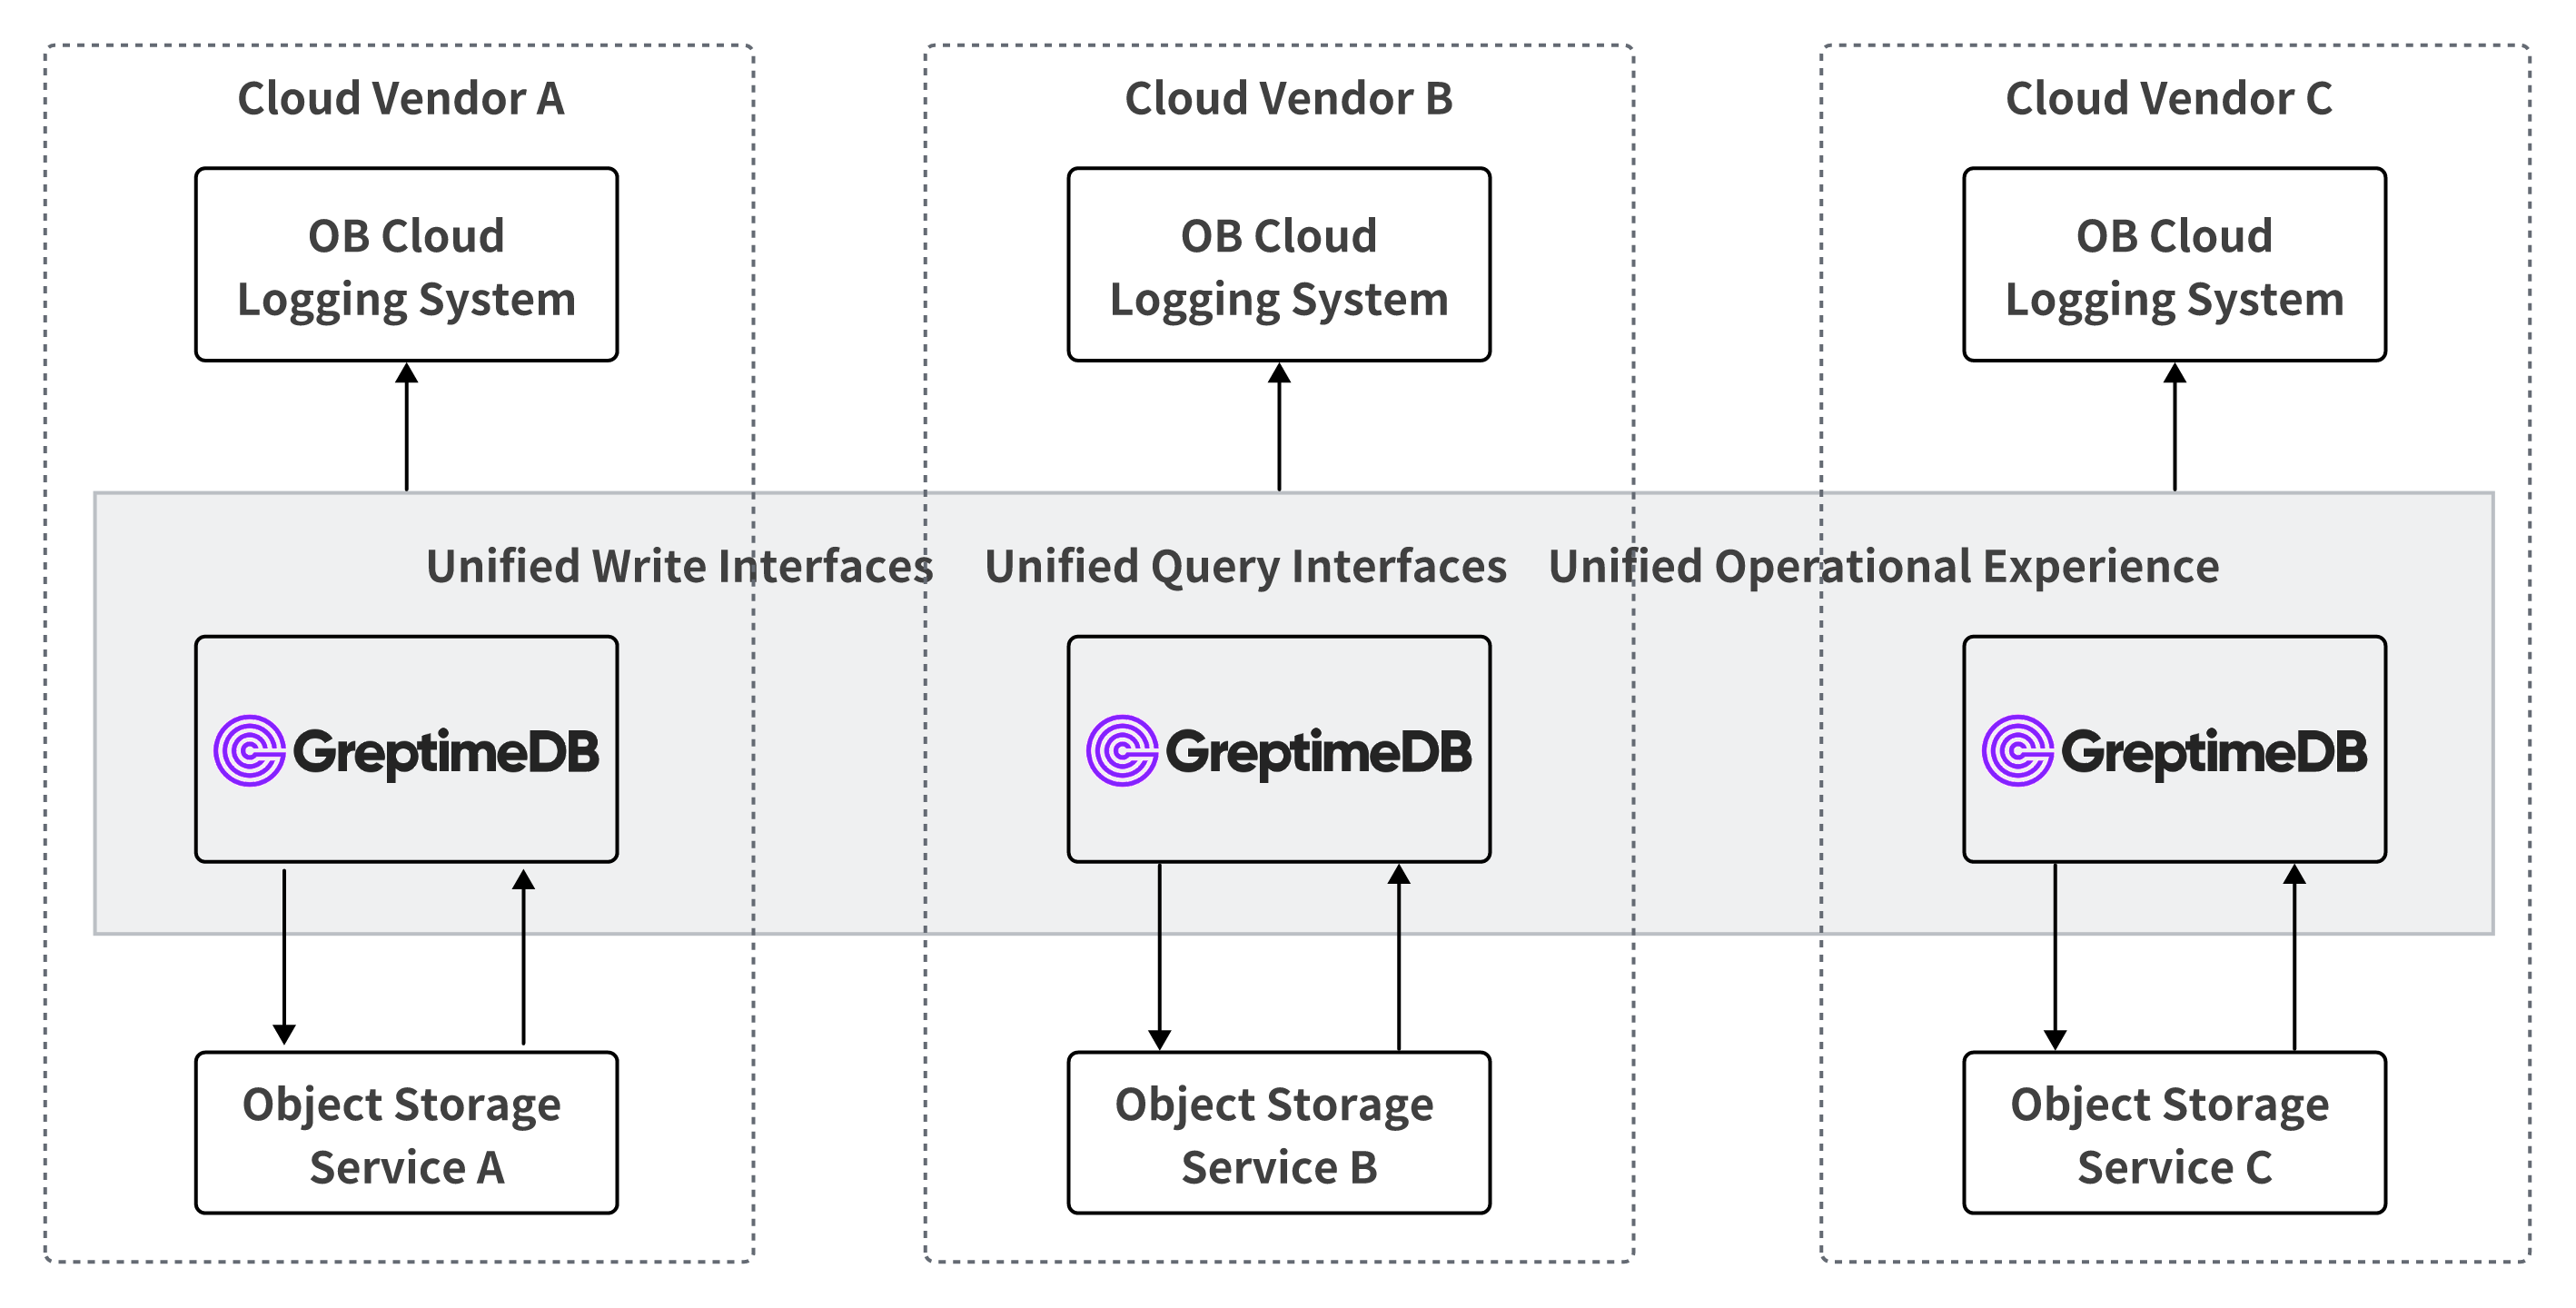
This topology gives the same write protocol, SQL query interface, and operational experience on every cloud. The log system on top is identical regardless of which cloud the cluster runs in.
Practice
Pipelines for Parsing and Field Extraction
Fluent Bit emits JSON to GreptimeDB. A GreptimeDB pipeline parses the JSON, extracts fields, and writes to the log table. Hostnames, file paths, and similar attributes go into dedicated columns so queries can filter by them directly.
Some OB Cloud applications produce log lines that span multiple newlines, which dissect cannot cleanly split. For those, OB Cloud uses the regex processor:
yaml
processors:
  - regex:
      fields:
        - message
      patterns:
        - '^(?P<timestamp>\d{4}-\d{2}-\d{2} \d{2}:\d{2}:\d{2}(\.\d+)?)[ ,](?P<message>(?s:.*))$'
      ignore_missing: true
  - date:
      fields:
        - message_timestamp
      formats:
        - '%Y-%m-%d %H:%M:%S%.3f'
        - '%Y-%m-%d %H:%M:%S%.6f'
        - '%Y-%m-%d %H:%M:%S%.9f'
        - '%Y-%m-%d %H:%M:%S%.f'
        - '%Y-%m-%d %H:%M:%S%'
      timezone: 'Asia/Shanghai'
      ignore_missing: true
transform:
  - fields:
      - message
    type: string
  - fields:
      - file
      - host
    type: string
    index: tag
  - fields:
      - message_timestamp,timestamp
    type: epoch, ns
    index: timestamp
The end-to-end flow looks like this:
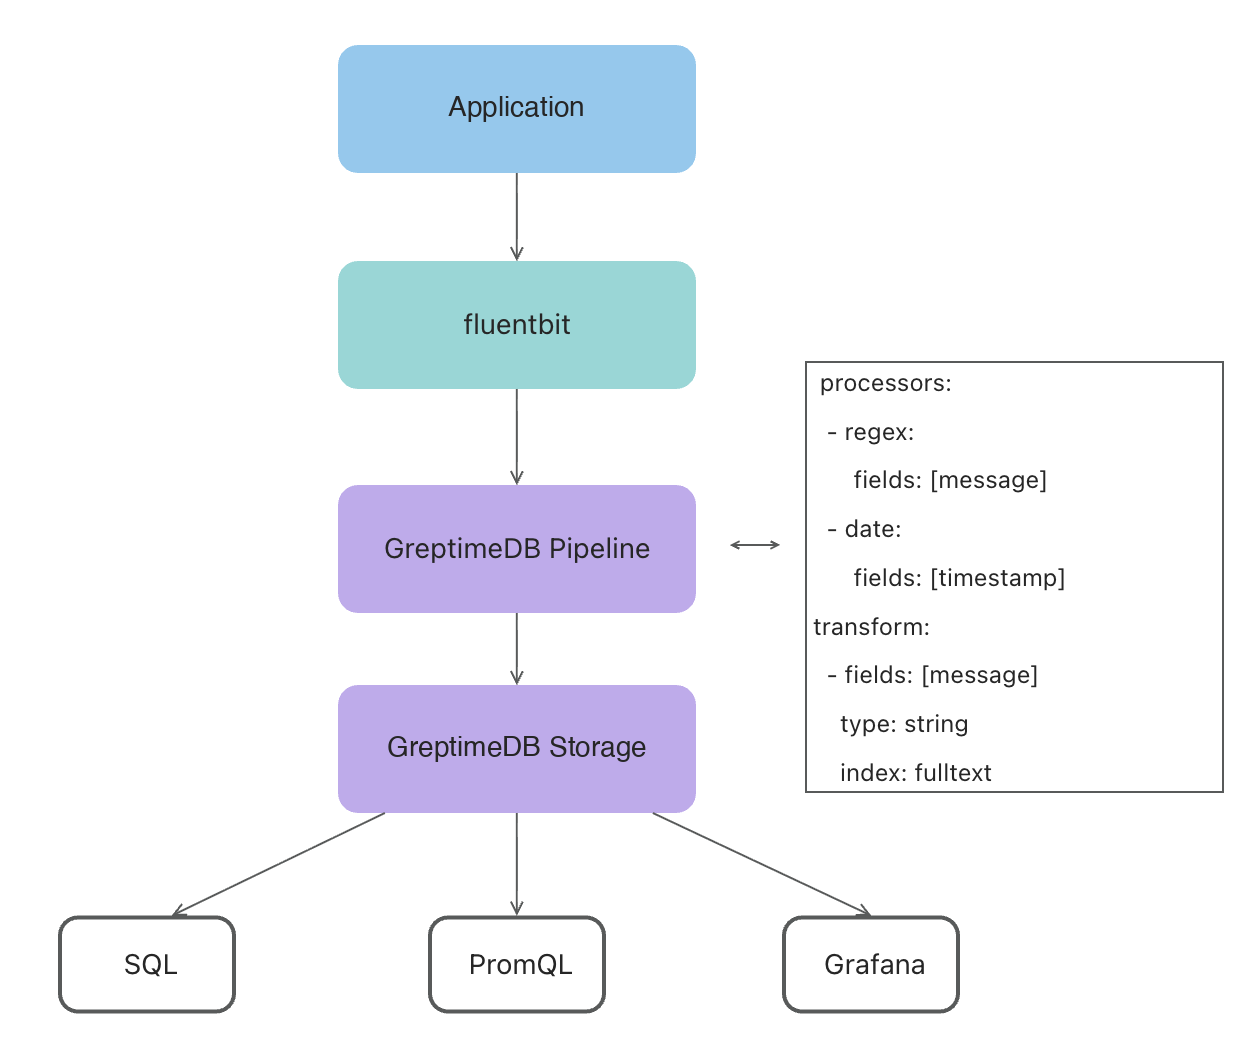
Table Design
A representative log table:
sql
CREATE TABLE IF NOT EXISTS "xx_log" (
  "timestamp" TIMESTAMP(9) NOT NULL DEFAULT current_timestamp(),
  "file" STRING NULL,
  "host" STRING NULL,
  "ip" STRING NULL,
  "request_id" STRING NULL SKIPPING INDEX,
  "message" STRING NULL FULLTEXT,
  TIME INDEX ("timestamp"),
  PRIMARY KEY ("file", "host", "ip")
)
ENGINE = mito
WITH (
  append_mode = 'true',
  'compaction.twcs.time_window' = '2h',
  'compaction.type' = 'twcs',
  ttl = '15days'
);
A few notes on the choices:
append_mode = 'true'matches the append-only nature of logs and avoids overhead from versioning rows that never change.- TWCS with a 2-hour time window plus a 15-day TTL aligns with the 95-percent-not-queried access pattern: data is grouped by recency, old windows expire cleanly, and compaction stays bounded.
- Index choices follow what the field is used for:
request_iduses a SKIPPING INDEX for high-cardinality point lookups,messageuses a FULLTEXT index for keyword search, and the rest stay un-indexed to keep storage cheap.
Tuning Fluent Bit
During traffic spikes Fluent Bit logs showed mem buf overlimit, indicating backpressure. Server-side metrics on GreptimeDB looked clean and Fluent Bit's own resource usage was not high — the bottleneck was its buffering configuration:
- Fluent Bit holds collected logs in an in-memory buffer (
mem_buf); when full, collection pauses. mem_buf_limitsets the buffer size and effectively caps Fluent Bit's memory footprint.flushcontrols how often the buffer is sent downstream. With a smallmem_buf_limitand a largeflushinterval, the sender cannot keep up during peaks.- Log rotations are noticed only every 60 seconds by default (
Refresh_Interval), so rotated files start ingesting late.
Tuning flush, mem_buf_limit, and Refresh_Interval together largely eliminated lag and backpressure at peak traffic.
Loki vs GreptimeDB, One Year On
| Dimension | Loki | GreptimeDB |
|---|---|---|
| Query performance | Times out on large data | Sub-second to single-second on a full day of logs |
| Index capability | Labels only | Full-text plus skipping/inverted indexes |
| Multi-cloud | Deployable, mediocre experience | Native multi-cloud, unified interface |
| Storage cost | Object storage, low | Object storage with high compression, lower |
| Query time range | Minutes | Hours to days |
| Operations | Medium complexity | K8s-native, simpler |
Issues Across GreptimeDB Versions
The migration was smooth on the happy path, but production-scale workloads surfaced issues that drove version-by-version improvements:
- Pipeline filtering wasn't supported before 0.15. Some scenarios only need to retain logs at certain levels or matching specific keywords. Without filtering, OB Cloud was ingesting everything. 0.15 added pipeline filters, letting OB Cloud drop unneeded logs at ingest time and reduce storage cost directly.
- The
matchesfunction in 0.12 was awkward to use. The query syntax for keyword matching was complex. 0.13 introduced a new full-text index implementation with cleaner query functions, simplifying queries and improving performance at the same time. - Datanode compaction memory could blow up under heavy writes. At high write volumes, datanode compaction would balloon memory and occasionally OOM. The OB Cloud team had to tune compaction parameters and scale up datanodes to keep things stable. 0.15 reworked the compaction file-merge strategy, sharply lowering peak memory during compaction; datanode memory now stays steady end-to-end.
- Early metaserver did not fully support RDS. OB Cloud had to stand up a separate etcd to hold metadata, which added operational surface. 0.15 made the metaserver fully RDS-compatible and shipped a metadata migration tool. OB Cloud used that tool to cut over to GreptimeDB Enterprise on 0.15.
Moving to GreptimeDB Enterprise
At 80+ clusters with the largest one at 50 TB, the operational surface justified the move to GreptimeDB Enterprise. It brought three categories of capabilities:
- Performance and scalability: higher write throughput, read replicas, intelligent tiered cache.
- Intelligent automation: auto-scaling, auto-partitioning, auto load-balancing, auto backup, intelligent flow control, remote compaction and indexing.
- Operations and management: enterprise console, performance diagnosis, 1-on-1 expert support with 7×24 response, custom services.
Where OB Cloud Is Now
- Coverage: all four log types and SQL audit data are stored on GreptimeDB.
- Scale: 80+ GreptimeDB clusters in production. 300 TB of data under a 7-day retention. Largest single cluster holds 50 TB. Average sustained write throughput is around 1 GB/s.
- Cost: overall log storage cost is down by more than 60%.
- Customer impact: SQL audit pricing for end customers was lowered accordingly, passing through more than 60% savings on SQL audit cost.
What Comes Next: An Intelligent Diagnosis Agent
Production stability at this scale rests on three things: an experienced SRE team, a layered system (inspections, monitoring and alerting, root-cause analysis and runbooks), and an AI agent that's online 7×24.
The OB Cloud Intelligent Diagnosis Agent puts these pieces together:
- LLM as the reasoning core.
- Skills encoding expert experience.
- MCP as the data pipeline and context source.
- Knowledge base of technical docs, support tickets, and historical incidents.
- Scheduled runs for periodic checks.
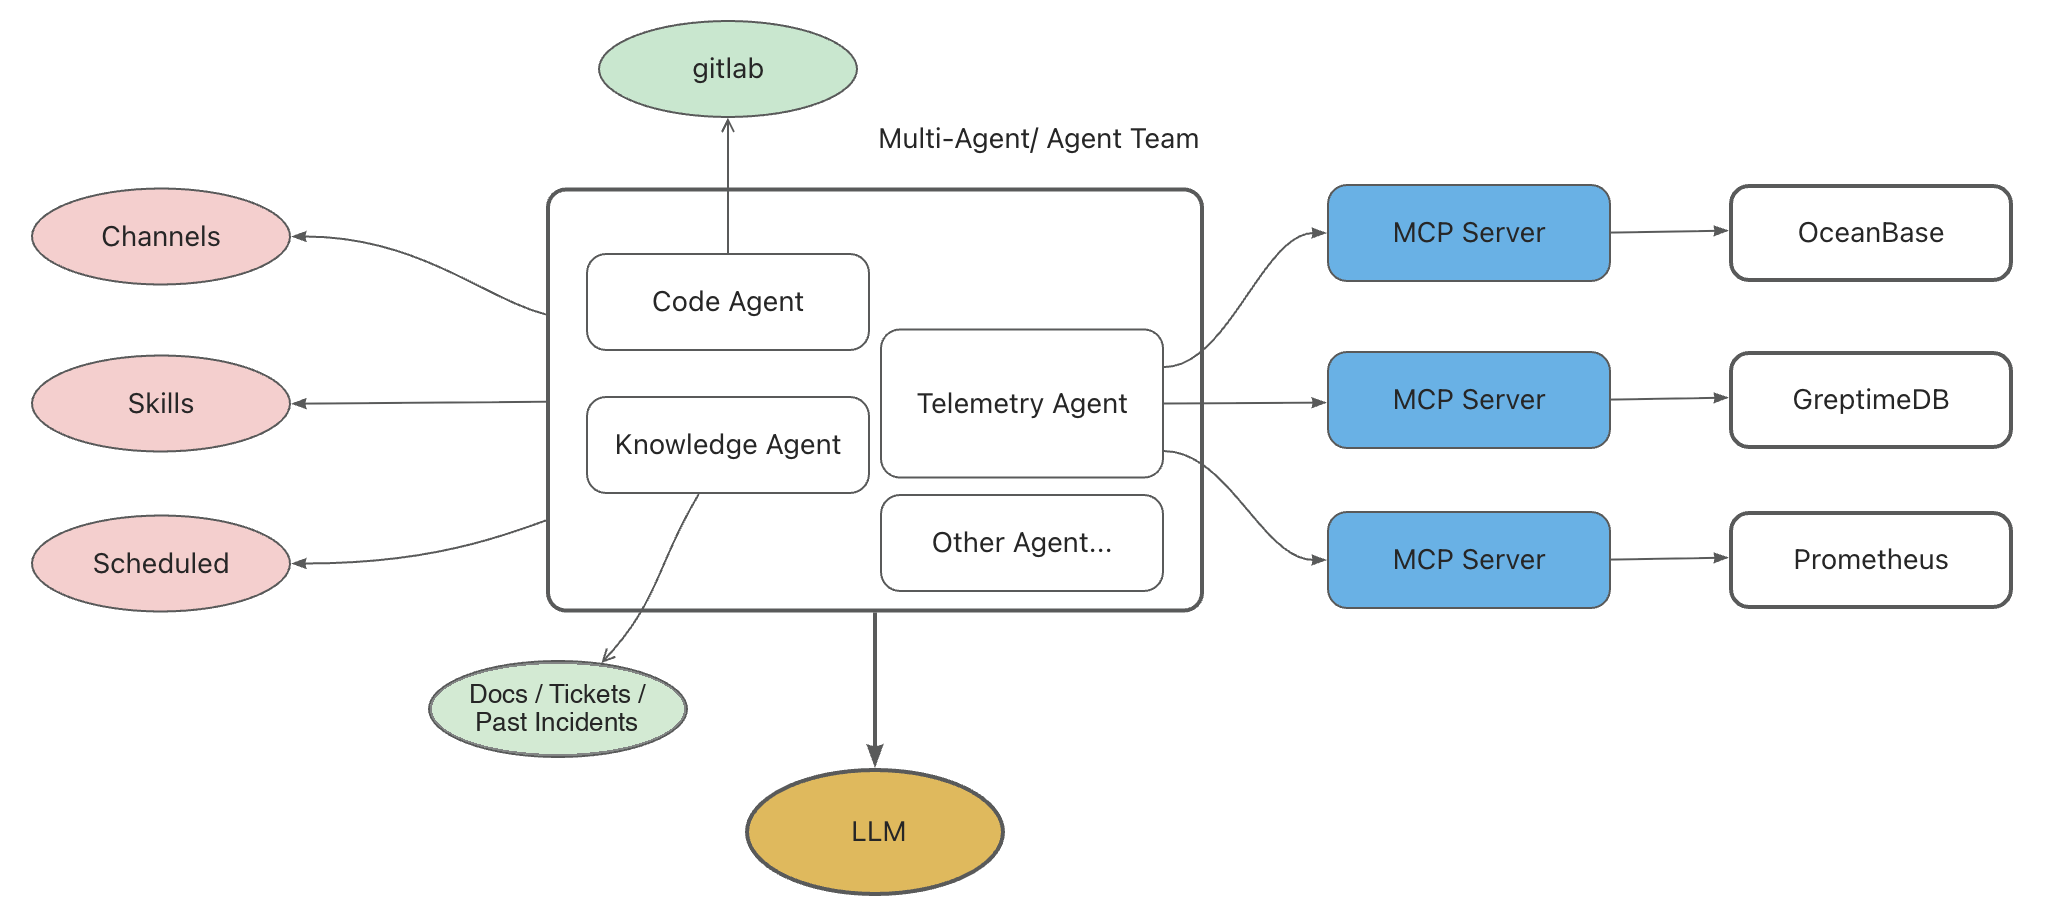
GreptimeDB shows up here as a first-class data source. The Telemetry Agent talks to GreptimeDB MCP Server to pull Top-SQL out of the SQL audit table. A typical request reduces to a SQL query like:
sql
SELECT *
FROM sql_audit_<cluster>
WHERE request_timestamp >= NOW() - INTERVAL '10 MINUTES'
  AND tenant_name = '<tenant>'
ORDER BY affected_rows DESC
LIMIT 20;
The same data the SRE team relies on for postmortems is now directly available to the LLM for live diagnosis.
Closing
A year of running at OB Cloud's scale validated the bet: a multi-cloud-neutral, columnar, full-text-indexed store with object-storage backing and a unified SQL surface holds up at 80+ clusters and 300 TB. The work going forward is broader observability data into the same store and deeper integration with the diagnosis agent.


