On this page
We’re pleased to introduce an important update to the Dashboard: a brand-new Metrics Query view and a more powerful Flow Management interface. Users can now view real-time metrics and manage flows more easily, while enjoying a smoother and more efficient experience in SQL queries.
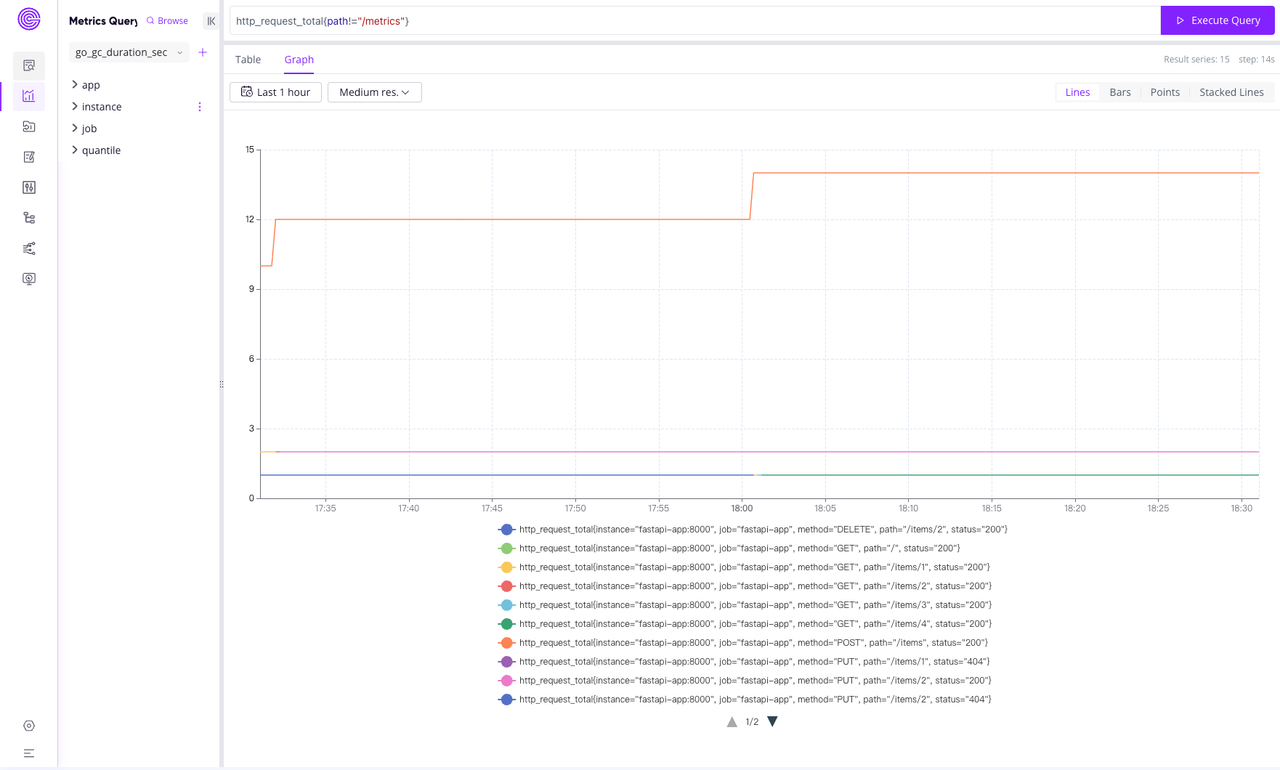
Metrics Query: Easily View Real-time Metrics
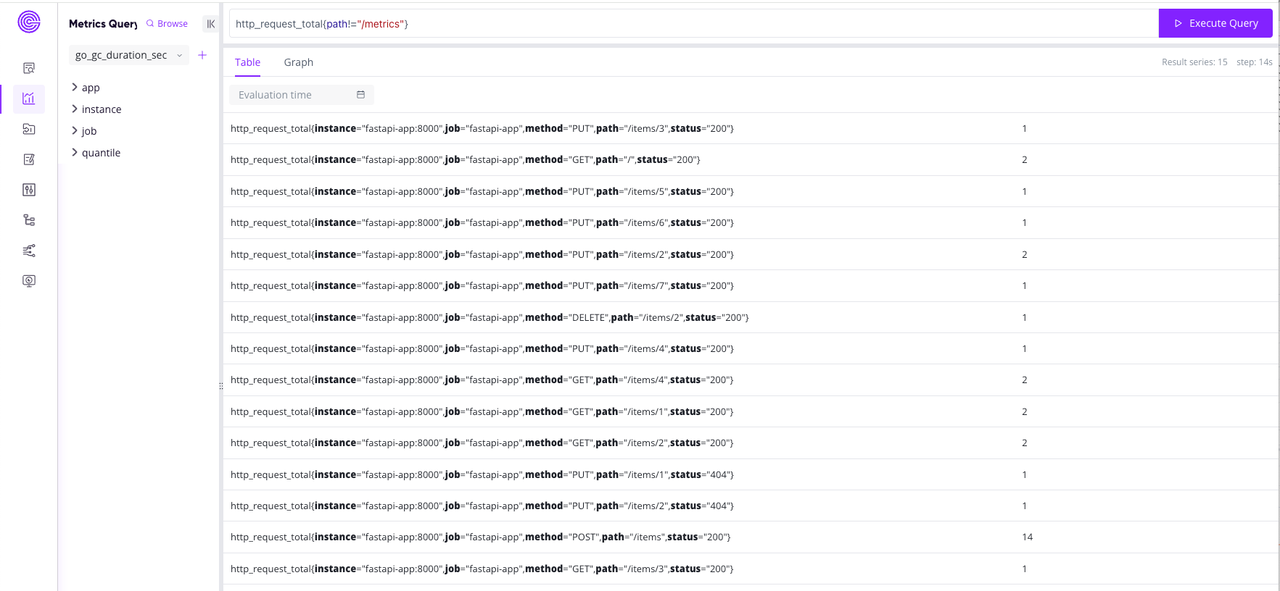
Key features:
- Assistant PromQL Editor.
- Table View for Instant Query.
- Chart View for Range Query with Custom Query Time And Step.
- Browse Metrics, labels and values via the sidebar and assist in generating PromQL.
Flow Management: Easily Create and Manage Data Flows
Two creation methods:
- Form Mode: Create a Flow by simply filling in a few required fields.
- Raw Statement Mode: Directly write the complete creation statement for more flexible control.
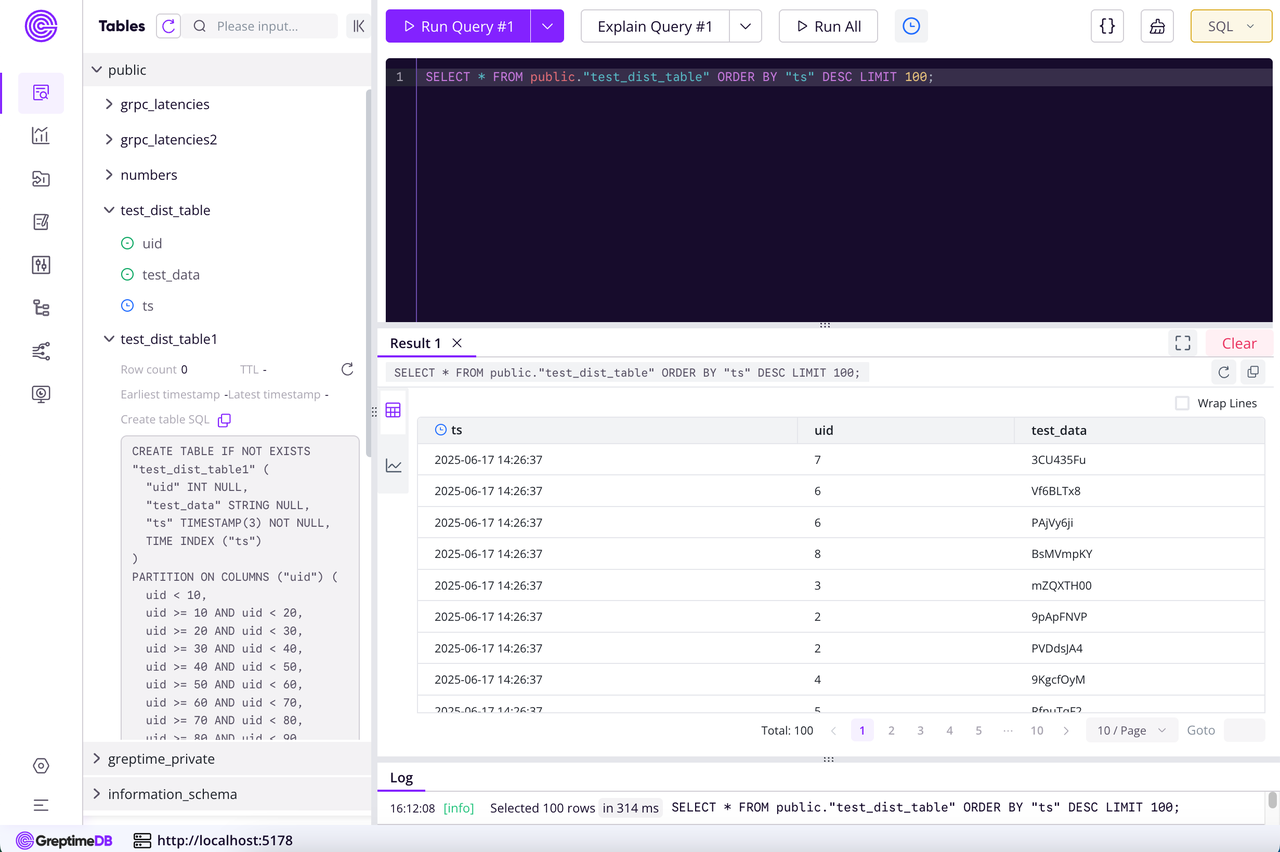
Query UI Enhancements
We’ve also improved the SQL Query experience with several updates:
- Rerun Button: Re-execute the SQL directly from the result view—no need to switch back to the editor.
- Query Display & Copy: View the executed SQL statement in the result panel and copy it with one click.
- Result View Refinement: Moved the Chart/Table switcher to the left for clearer interaction.
More details can be found in PR [dashboard#554](https://github.com/GreptimeTeam/dashboard/pull/554.
Summary
This Dashboard update delivers a more intuitive Metrics Query experience and a more flexible Flow Management interface, making it easier and faster to monitor metrics and manage data flows.
Meanwhile, the improved SQL Query view offers a smoother and more efficient debugging and analysis experience. We hope these enhancements make working with the Dashboard simpler, more powerful, and more enjoyable.


