On this page
This article is based on an interview with Jacson, one of the founders of D6, written in collaboration between the D6 and Greptime teams.
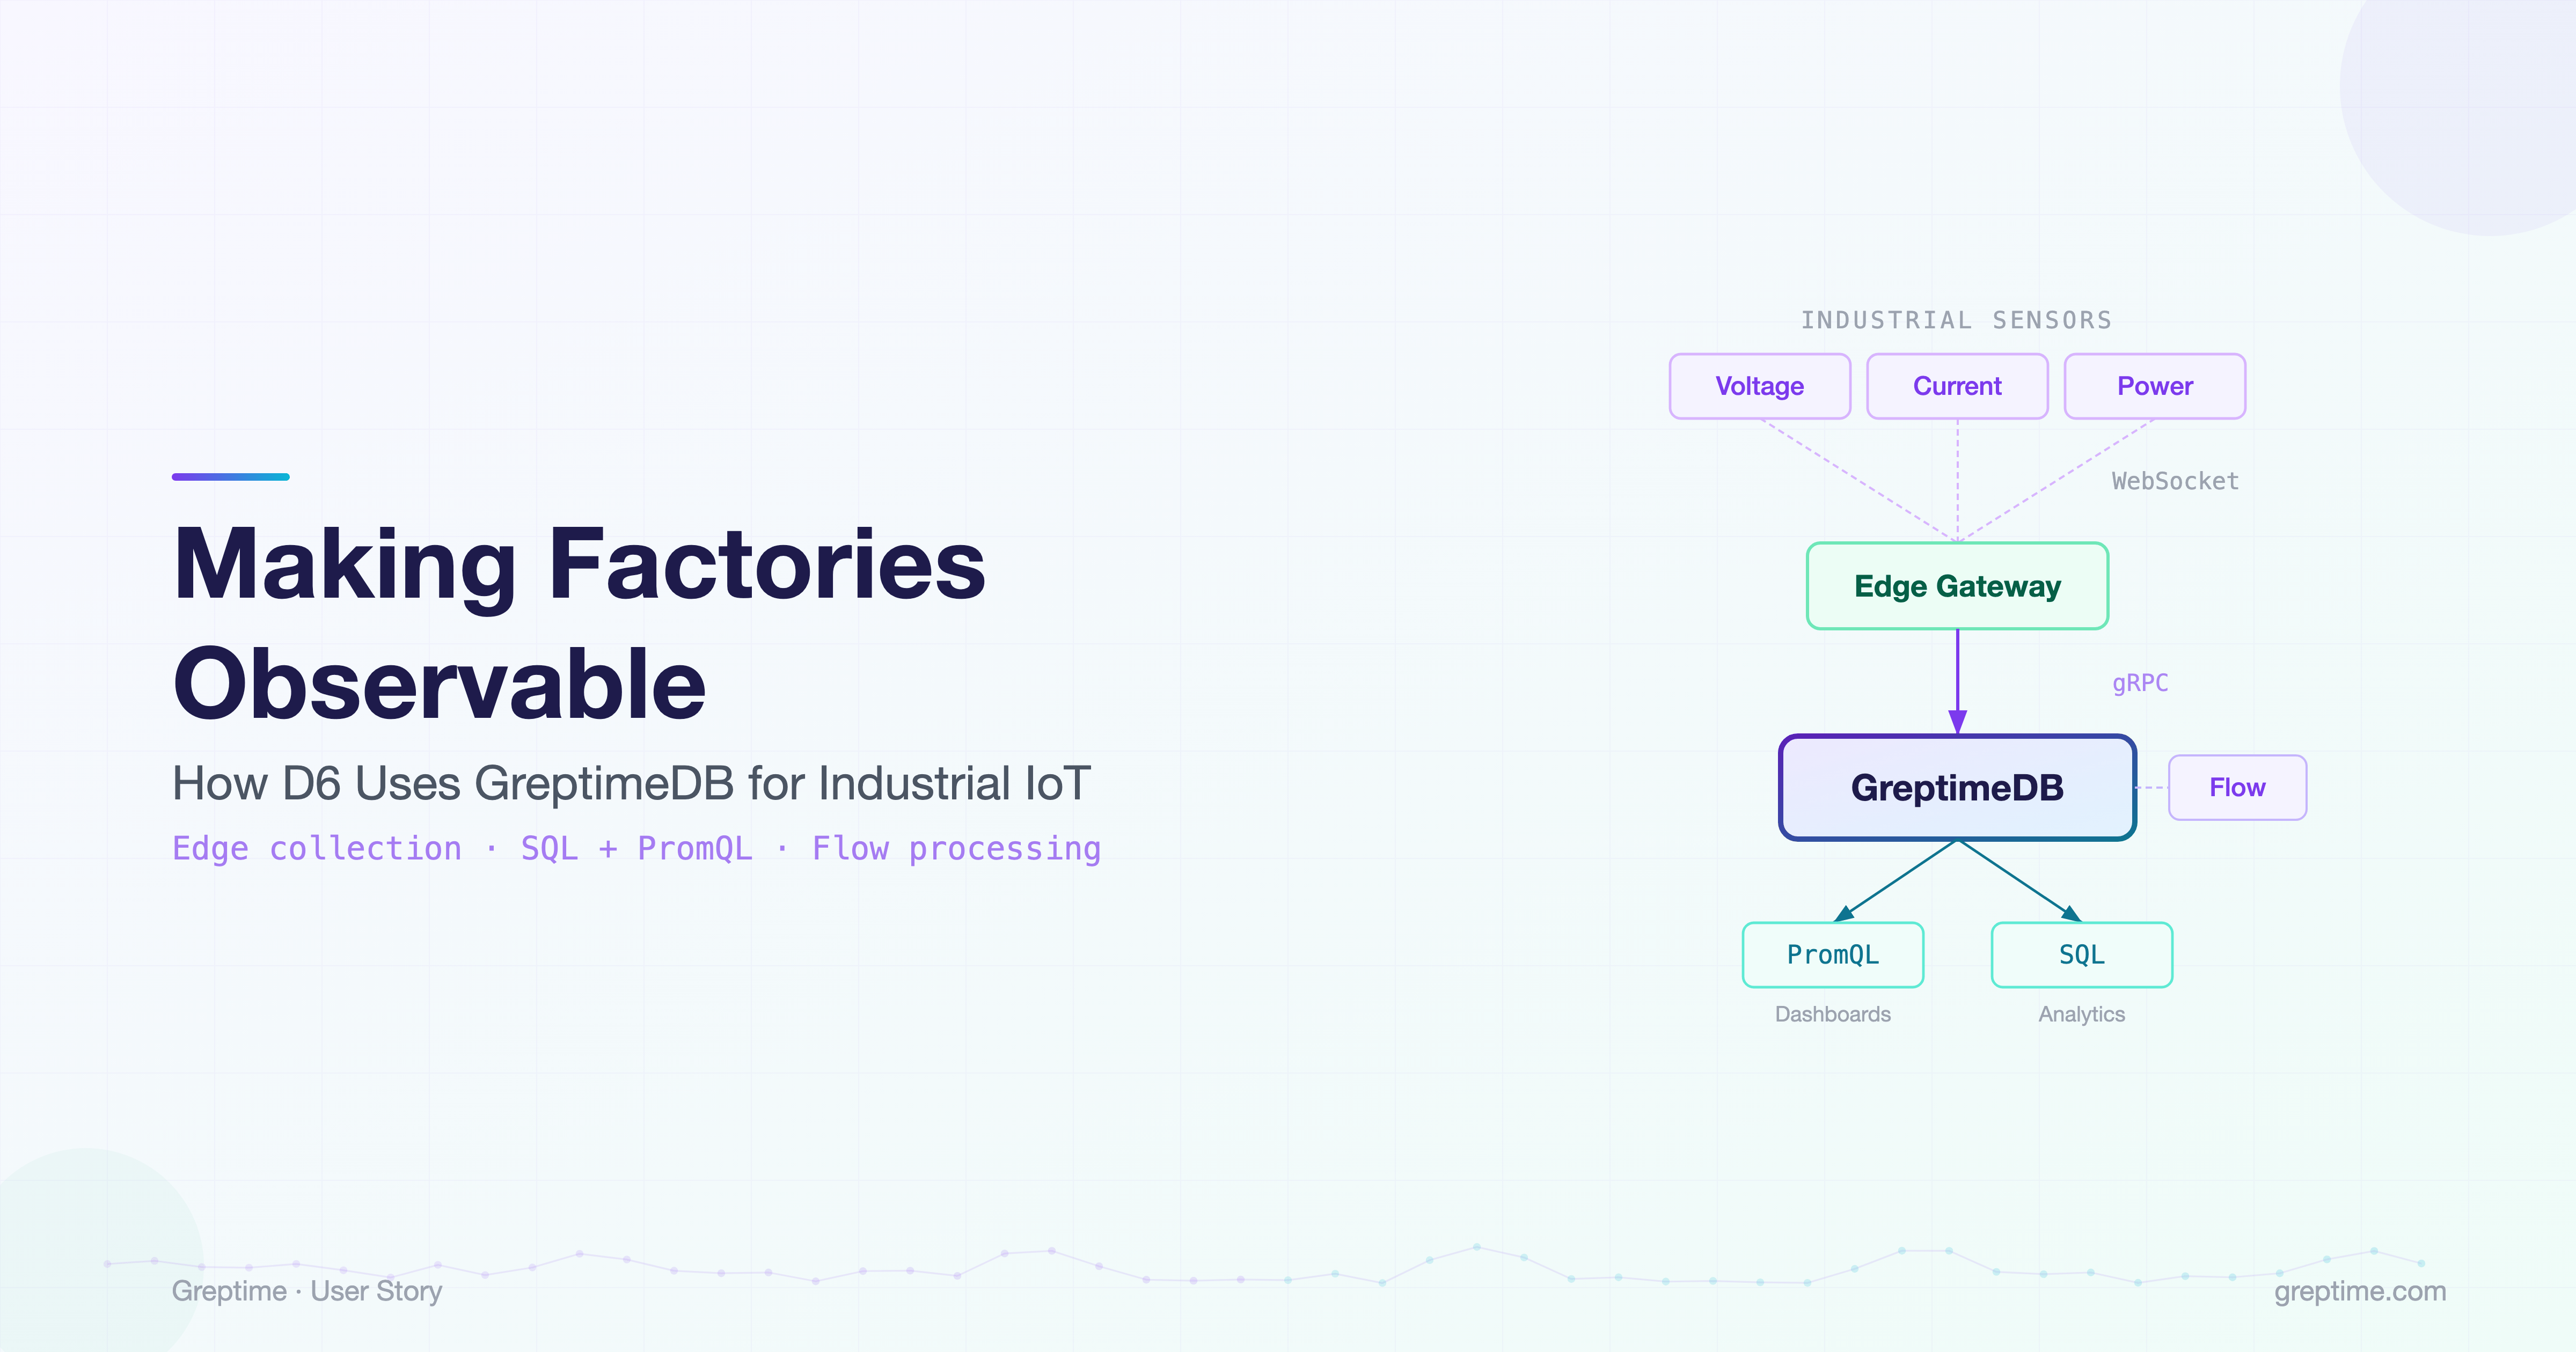
Jacson has been involved in software development for over 10 years. D6 is a team based in Brazil building an Industrial IoT platform that brings cloud-style observability to factory floors. Their product monitors energy consumption and production signals from industrial equipment, giving manufacturing plants and mining operations real-time and historical visibility into how their machines operate. This post covers why they moved from VictoriaMetrics to GreptimeDB, what their architecture looks like, and what they learned along the way.
The goal: monitor machines like cloud infrastructure
D6 wants to give factory operators the same kind of insights you get from cloud systems — metrics, monitoring, and dashboards — but for machines on the factory floor. Their goal is to help companies improve factory efficiency by understanding how their equipment works, both in real time and over time.
Their platform installs sensors on industrial machines, collects electrical and operational measurements through edge gateways deployed on-site, and streams everything to a centralized cloud pipeline for analysis.
The kinds of data they collect:
- Electrical measurements: voltage, current, power draw
- Production indicators derived from machine activity
- Operational states inferred from sensor behavior patterns
Their current deployment covers about 20 industrial assets across 10 edge gateways and 30 sensors, with over 1.2 billion data points stored so far. The goal is to retain data for up to 10 years — long-term trends in industrial energy usage are where the real value lives.
Why VictoriaMetrics wasn't enough
Before GreptimeDB, D6 ran VictoriaMetrics. It worked well for what it does: metrics ingestion and storage are efficient, and PromQL queries kept dashboards running.
The problem showed up when they needed more flexible access to the underlying data. They had a concrete case: exporting historical data and restructuring it for further analysis. They realized this would not be straightforward with VictoriaMetrics.
That triggered a search for a time-series database that could provide strong analytical capabilities alongside efficient time-series storage. TimescaleDB came up as a candidate — it offered the SQL flexibility they wanted — but it required significantly more infrastructure resources for their workload, making it financially impractical.
What they actually needed: a system that combined efficient time-series ingestion with SQL-based analytics, without greatly increasing operational complexity.
Why GreptimeDB
D6 found GreptimeDB while researching open-source time-series databases. What caught their attention was the ability to combine SQL and PromQL in the same system.
This combination maps directly to their workflow:
- PromQL is great for building dashboards and monitoring metrics
- SQL allows for more in-depth analysis and transformations across historical datasets
Operational simplicity was another factor. Running GreptimeDB in standalone mode helped them keep infrastructure simple and optimize costs during the early stage of their product.
GreptimeDB's gRPC ingestion endpoint let their cloud ingestion pipeline write data into the database directly, without an extra adapter layer. And the distributed architecture gives them confidence that the system will scale as they onboard more customers and industrial assets.
Architecture
D6's architecture focuses on edge data collection and centralized time-series analysis:
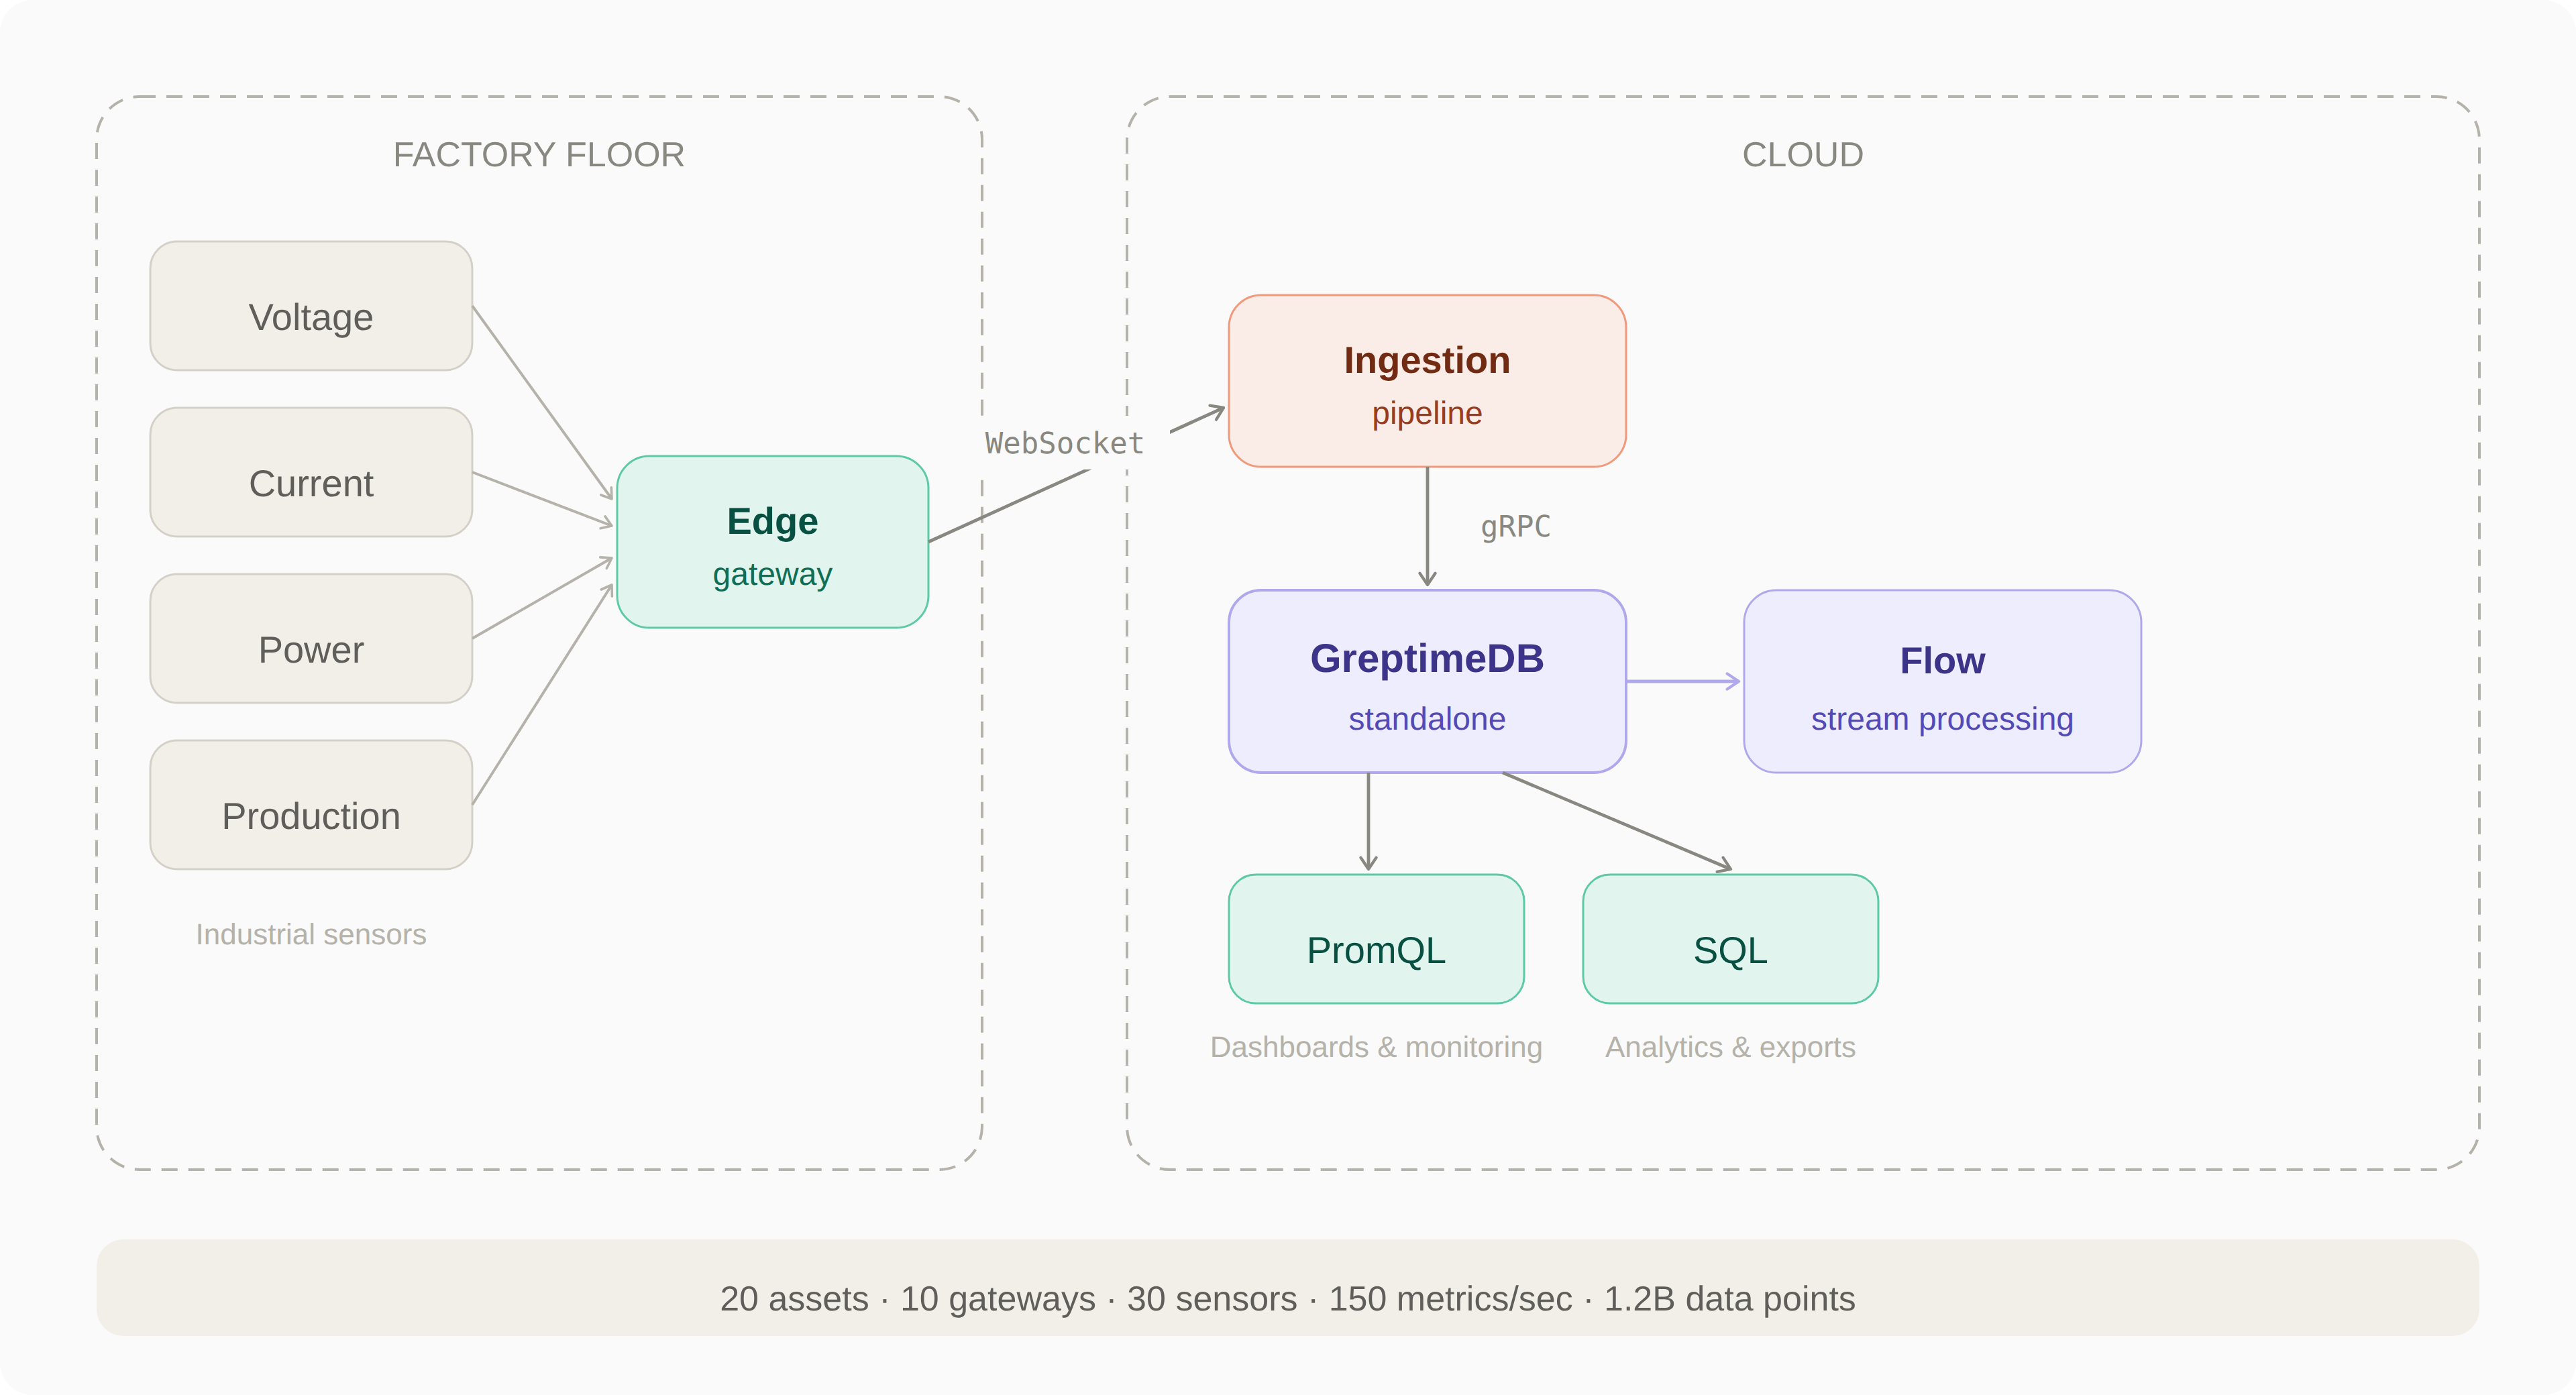
Sensors collect industrial measurements directly from machines. Edge gateways deployed at each customer site aggregate this data and push it to the cloud-side ingestion pipeline over a WebSocket connection. The ingestion pipeline then writes the data into GreptimeDB via gRPC. Dashboards and analytics systems query the data using SQL and PromQL.
The current deployment runs on a single standalone GreptimeDB node, reliably managing over 1.2 billion data points with continuous ingestion.
From raw signals to operational insights
One of the biggest improvements after adopting GreptimeDB was the ability to combine SQL queries with Flow (GreptimeDB's built-in stream processing engine) to extract higher-level insights from raw sensor data.
With VictoriaMetrics, D6 was mostly limited to PromQL queries focused on monitoring. With GreptimeDB, they can query historical datasets using SQL and pre-process incoming data with Flow to generate derived indicators.
Here's a practical example. Industrial machines produce detailed electrical measurements. By analyzing a machine's energy signature over time, D6 can infer:
- Whether a machine is running or idle
- Operational cycles
- In some cases, even the type of product being manufactured, based on its electrical consumption pattern
Processing and enriching time-series data directly in the database simplifies their pipeline. They don't need a separate stream processing system, and they can continuously refine these indicators as more data is collected.
Lessons learned
Query performance: non-millisecond time indexes and filter pushdown
D6 noticed that some of their PromQL queries were getting slower over time. After investigating with TQL ANALYZE, they found the root cause: the system was scanning much more data than necessary.
Editor's note: GreptimeDB's PromQL implementation lets you analyze query plans and execution details to diagnose performance issues. See the
TQL ANALYZEdocumentation for details.
The underlying issue: D6's data uses microsecond-precision timestamps, but the PromQL engine works in milliseconds. When the query planner processes a time filter, it inserts a cast projection over the time index to convert timestamps to milliseconds, and places the filter above that projection. The consequence is that the time predicate doesn't get pushed down into the TableScan — SST time-range pruning becomes ineffective, and what should have been a small time-window query degrades into a full table scan.
The resulting plan looks roughly like this:
Filter: timestamp >= TimestampMillisecond(...) AND timestamp <= TimestampMillisecond(...)
  Projection: CAST(metrics.timestamp AS Timestamp(ms)) AS timestamp
    TableScan: metrics [timestamp:Timestamp(ns)]
With the filter sitting above the projection, ScanRequest.filters doesn't carry the time-range predicate, and the storage layer falls back to scanning the full range.
The GreptimeDB team has confirmed this as a bug and is working on a fix. The issue is being tracked in #7913 — if your workload involves non-millisecond time indexes, subscribe to follow progress.
Compatibility: the last mile matters
From D6's perspective, GreptimeDB has made great progress on compatibility, and it shows. Their main feedback: keep improving compatibility with existing ecosystems like PostgreSQL, MySQL, and PromQL.
"Getting those last mile details and edge cases figured out would make it much easier to integrate GreptimeDB into existing workflows and tools."
For a small team that relies on existing tooling and standard clients, compatibility edge cases create real friction. Every edge case that gets fixed is one less workaround to maintain.
Conclusion
D6's use case shows what happens when industrial equipment gets the same observability treatment as cloud infrastructure. Factory machines have always produced signals — electrical patterns, operational cycles, production data. The gap was the lack of tooling to collect, store, and analyze that data the way we do for servers and containers.
GreptimeDB gave D6 a single system that handles both their real-time monitoring needs (PromQL) and their analytical workloads (SQL + Flow) without a complex multi-system stack.
The architecture is designed to scale. GreptimeDB's distributed mode is there when they need it, and the data model they've built — raw sensor signals enriched into operational indicators through Flow — gets more valuable with every machine they add.
As Jacson put it: "Overall, really great work. We're excited to keep building on it."
D6 is a Brazilian Industrial IoT team building observability for factory equipment. To learn more about GreptimeDB, visit greptime.com or check the documentation.


