On this page
AI agents aren't just chatbots anymore. They inspect database schemas, generate SQL, run queries, and decide what to do next based on the results. The whole loop takes seconds. Databases have a new kind of user.
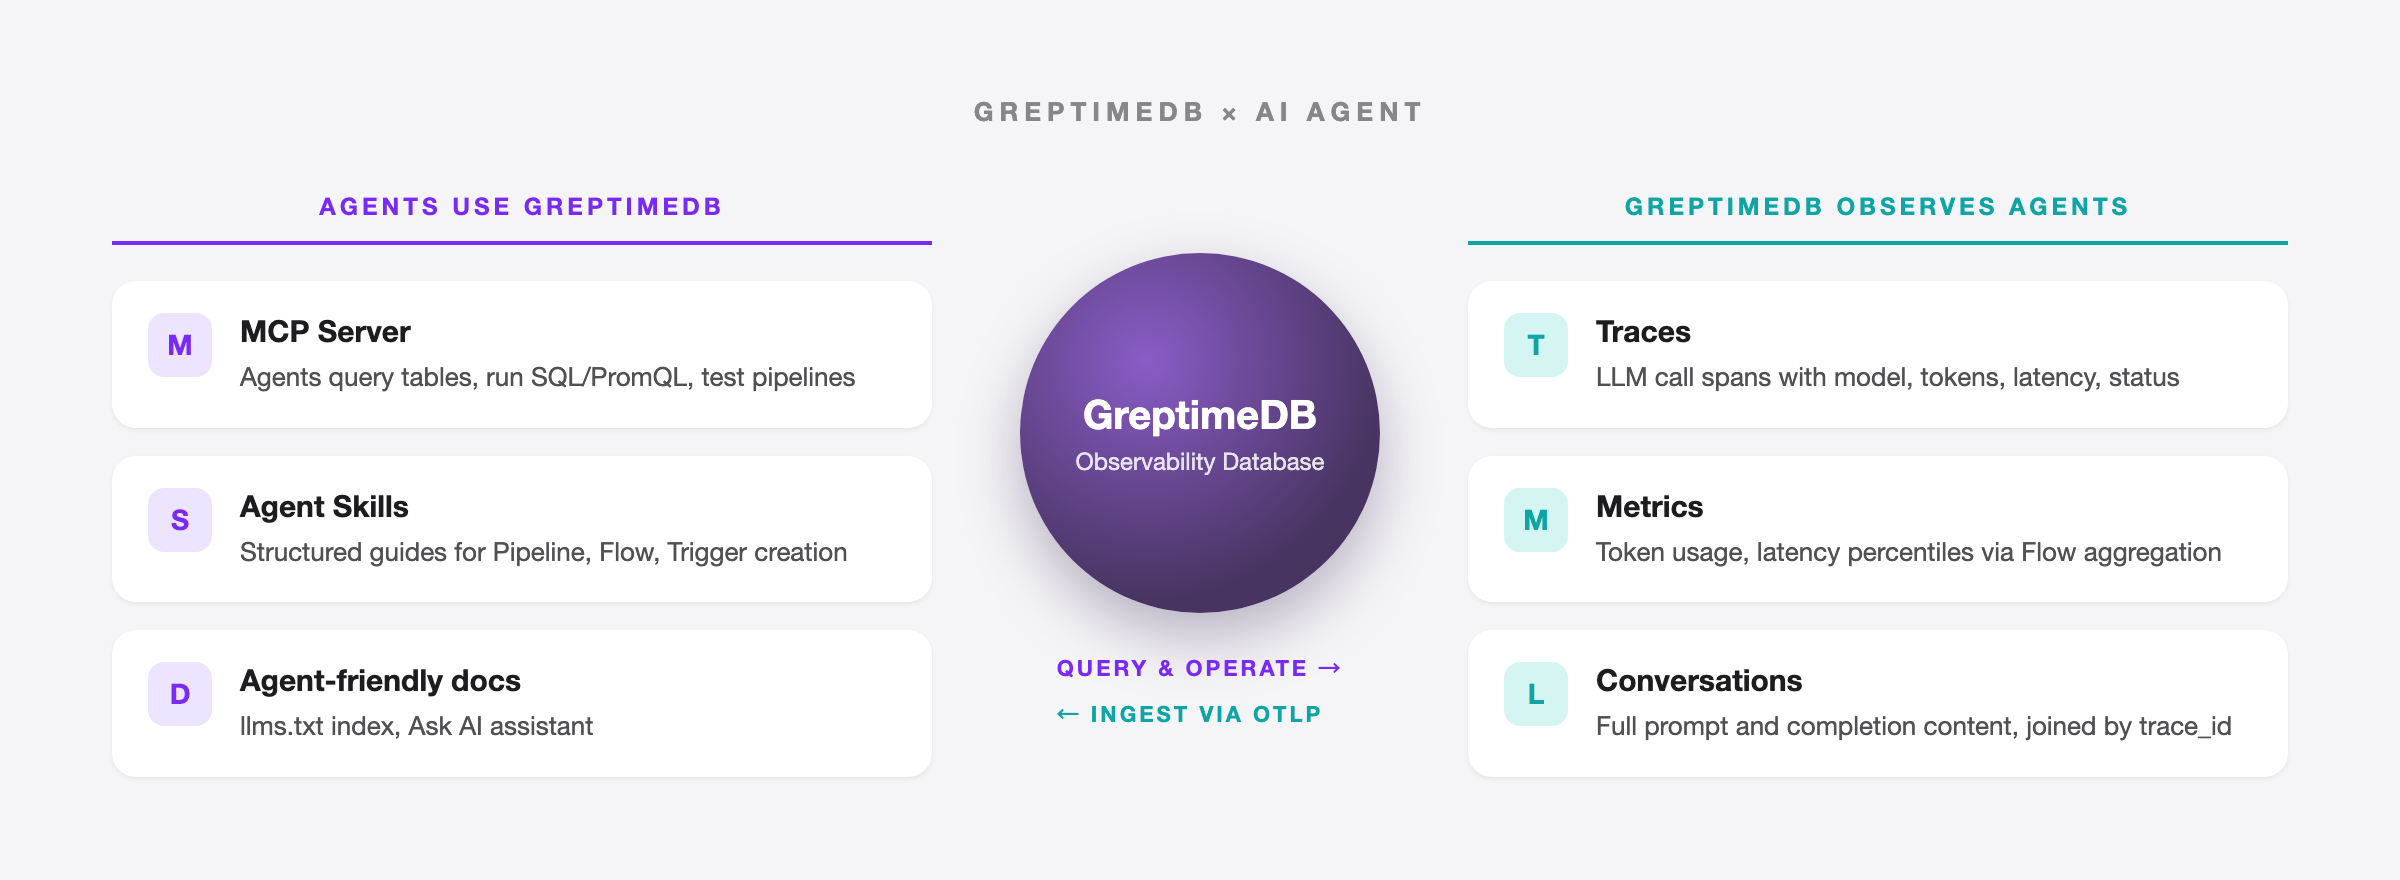
For GreptimeDB, this plays out in two ways. The obvious one: letting agents connect, query data, and run operations. The less obvious one: as an observability database, GreptimeDB is where agent behavior data naturally ends up. LLM call traces, token usage metrics, conversation logs, all observability signals.
This post walks through what we've built so far.
MCP Server: letting agents query observability data
Model Context Protocol (MCP) is an open protocol from Anthropic that gives LLMs a standard interface for connecting to external tools and data sources. We open-sourced the GreptimeDB MCP Server so AI agents can query and analyze GreptimeDB data via MCP.
One command to install:
bash
pip install greptimedb-mcp-serverConfigure it in Claude Desktop or any other MCP client, and an agent can list tables, read data, and run SQL, TQL (PromQL-compatible), and RANGE queries.
Built-in scenario templates
Most database MCP servers stop at "can execute SQL." Ours goes further with seven built-in prompt templates:
metrics_analysis— anomaly detection and aggregation query examplestrace_analysis— span queries, error rates, latency percentilespromql_analysis— PromQL query patternsiot_monitoring— IoT device monitoringpipeline_creator— log pipeline creation with full processor syntax, index selection guide, and format templateslog_pipeline— log pipeline managementtable_operation— table operations
Take pipeline_creator. It ships with GreptimeDB Pipeline's full syntax reference: how to write dissect, regex, date, and epoch processors, which index type fits which use case (inverted for low-cardinality filtering, fulltext for text search, skipping for high-cardinality IDs), and how to design log tables well. An agent loads this template and can produce a working Pipeline config from a single nginx log line.
Running it in production
A few things we added for real deployments:
- Data masking: enable
GREPTIMEDB_MASK_ENABLED=trueto replace sensitive values with******before they reach the LLM - Read-only enforcement: a security gate blocks DDL/DML operations, limiting agents to queries only
- Pipeline management:
create_pipelineanddryrun_pipelinelet agents create and test log processing pipelines - Multiple transports: stdio for development, SSE for compatibility, Streamable HTTP for production
More details in the MCP Server introduction and the v0.3 release post.
Agent Skills: teaching agents to operate GreptimeDB
The MCP Server gives agents tools. But tools alone aren't enough. Agents need to know how to combine them to finish a job. That's what Agent Skills are for.
Agent Skills is an open standard now supported by Claude Code, OpenAI Codex CLI, GitHub Copilot, Cursor, and others. A Skill is a SKILL.md file with structured instructions that agents load automatically when they hit a matching task.
We published three in the GreptimeDB docs repo:
greptimedb-pipeline
Walks agents through creating log processing pipelines in four steps:
- Learn — fetch Pipeline docs and understand processor and transform syntax
- Create — given a log sample, generate Pipeline YAML and a table definition
- Verify — if the MCP Server is available, test the config with
dryrun_pipeline - Refine — adjust for dispatch rules, index types, table options, or other requirements
greptimedb-flow
Guides agents through creating Flow tasks (continuous aggregation). The agent works out the time window and aggregation rules, generates CREATE FLOW and sink table DDL, then executes and verifies via the MCP Server's execute_sql tool.
greptimedb-trigger
Helps agents create alert rules. If the user has existing Prometheus alerting rule YAML, the agent converts it to GreptimeDB's CREATE TRIGGER syntax.
To install:
bash
npx skills add https://github.com/GreptimeTeam/docs/tree/main/skills/greptimedb-pipeline
npx skills add https://github.com/GreptimeTeam/docs/tree/main/skills/greptimedb-flow
npx skills add https://github.com/GreptimeTeam/docs/tree/main/skills/greptimedb-trigger
How Skills and the MCP Server work together
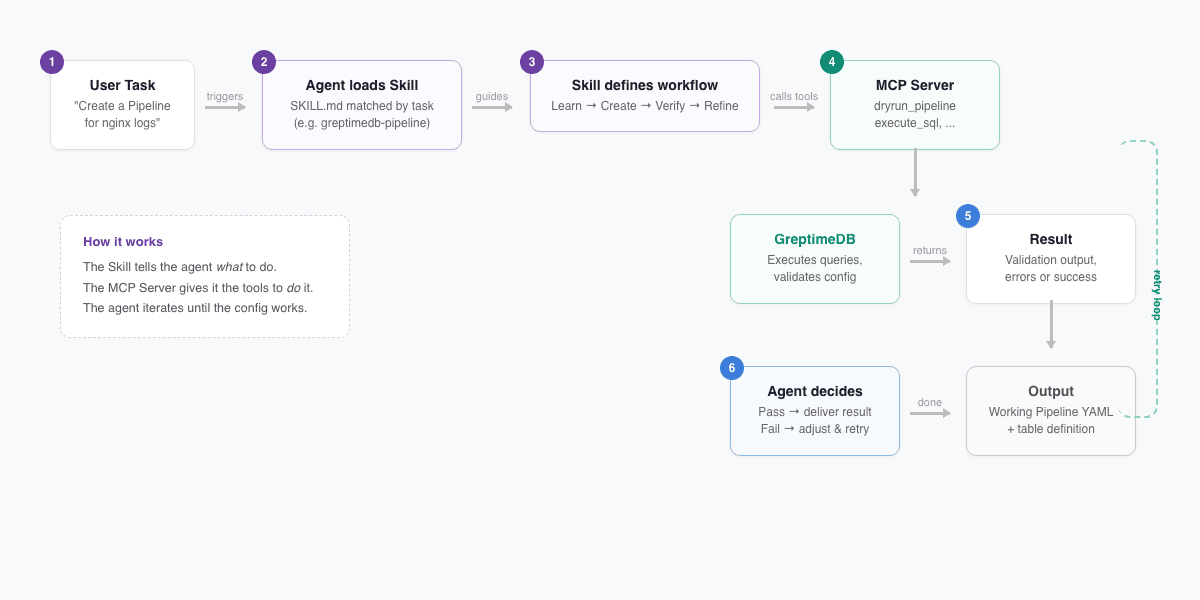
The important bit: Skills and the MCP Server are designed as a pair. The Skill tells the agent what to do; the MCP Server gives it the tools to do it. The greptimedb-pipeline Skill makes this explicit:
If greptimedb-mcp-server is available, use the
dryrun_pipelinetool to test the configuration.
The agent doesn't just generate a config and hand it off. It runs the test, checks the output, iterates, and keeps going until the config works.
All three Skills are task-oriented today; they walk an agent through a complete job end to end. We plan to add best-practice rules next (schema design, query optimization, write tuning) so agents follow GreptimeDB conventions when writing code, too.
GenAI observability: observing agents themselves
The first two sections covered how agents use GreptimeDB. This one flips the perspective: using GreptimeDB to observe agents and LLM applications.
GreptimeDB's Observability 2.0 architecture unifies metrics, logs, and traces as wide events in a single engine. LLM telemetry (call traces, token metrics, conversation logs) maps directly to these three signal types. No separate LLM observability tool required.
Three systems, one question asked three times
When an LLM application breaks, engineers need answers:
- Why is this request slow? Model latency or application logic?
- Token usage tripled last week. Which user? Which prompt?
- A user reports a bad answer. Can we find that conversation?
In a traditional stack, the data is scattered: Jaeger holds traces, Prometheus holds token metrics, Elasticsearch holds conversation content. One question, three UIs.
One database, three signal types
We built a complete demo using OpenTelemetry GenAI Semantic Conventions (gen_ai.* attributes) that shows GreptimeDB as a unified backend for all three.
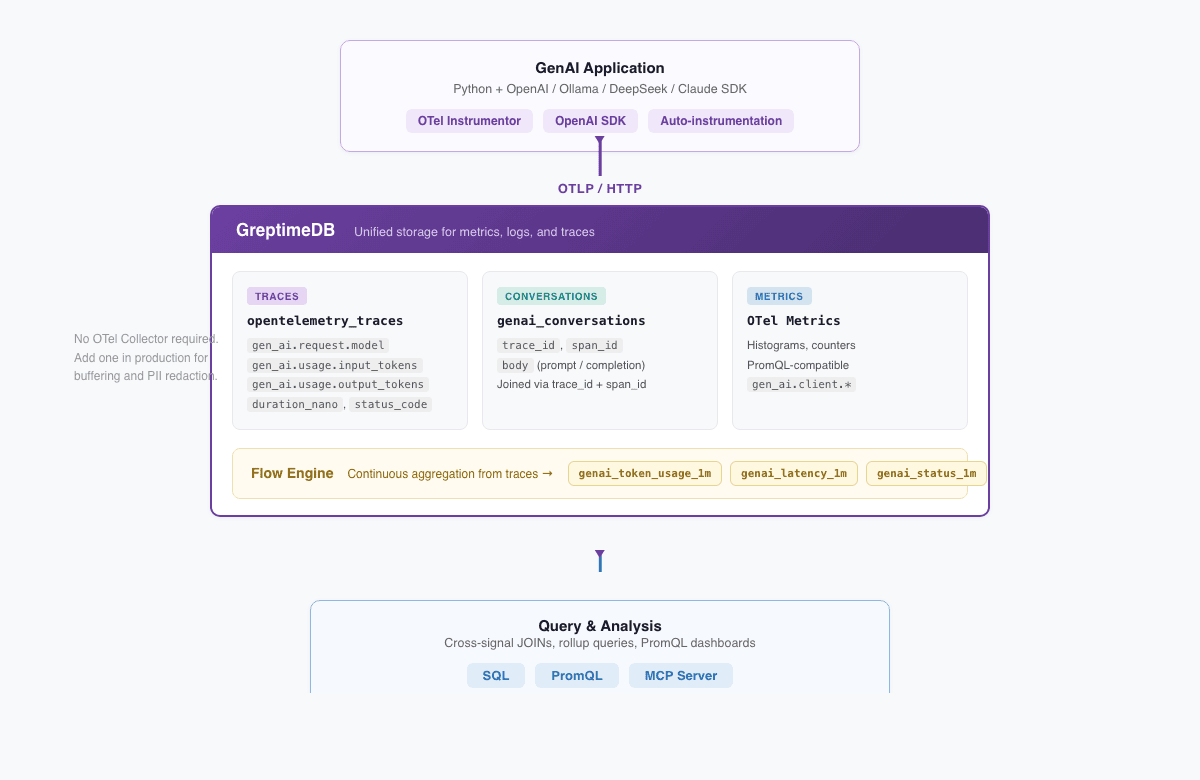
The architecture:
GenAI App (Python + OpenAI SDK + OTel Instrumentor)
  │
  │ OTLP/HTTP
  ▼
GreptimeDB
  ├── opentelemetry_traces  ← span attributes flattened into queryable columns
  ├── genai_conversations   ← full prompt and completion content
  ├── OTel metrics          ← histograms, PromQL-compatible
  └── Flow tables           ← continuously aggregated token/latency/status rollups
OTLP data goes straight to GreptimeDB with no OTel Collector in between. (You'd add one in production for buffering and PII redaction, but the demo keeps it minimal.) Instrumentation is one line:
python
from opentelemetry.instrumentation.openai_v2 import OpenAIInstrumentor
OpenAIInstrumentor().instrument()
The demo supports four backends (OpenAI, Ollama for local/free, DeepSeek, and Claude) and starts with one command:
bash
docker compose --profile load up -dCross-signal JOINs
With all three signals in one database, you can JOIN them directly. Find the highest-token user prompts with their model and token counts:
sql
SELECT
    t.trace_id,
    t."span_attributes.gen_ai.request.model" AS model,
    t."span_attributes.gen_ai.usage.input_tokens" AS input_tokens,
    t."span_attributes.gen_ai.usage.output_tokens" AS output_tokens,
    json_get_string(parse_json(c.body), 'content') AS user_message
FROM opentelemetry_traces t
JOIN genai_conversations c
  ON t.trace_id = c.trace_id AND t.span_id = c.span_id
WHERE t."span_attributes.gen_ai.system" IS NOT NULL
  AND json_get_string(parse_json(c.body), 'message.role') IS NULL
ORDER BY input_tokens DESC
LIMIT 10;
When traces and conversation logs live in separate systems, this correlation has to happen in application code. Harder to write, slower to run.
Flow Engine: deriving metrics from traces
GreptimeDB's Flow Engine runs continuous aggregation, like materialized views that refresh on their own. Each LLM call span is already a wide event with the model name, token counts, latency, and status code baked in. Flow derives metrics straight from traces, so the application doesn't need to write the same data twice:
sql
CREATE FLOW IF NOT EXISTS genai_token_usage_flow
SINK TO genai_token_usage_1m
EXPIRE AFTER '24h'
AS
SELECT
    "span_attributes.gen_ai.request.model" AS model,
    COUNT("span_attributes.gen_ai.request.model") AS request_count,
    SUM(CAST("span_attributes.gen_ai.usage.input_tokens" AS DOUBLE)) AS total_input_tokens,
    SUM(CAST("span_attributes.gen_ai.usage.output_tokens" AS DOUBLE)) AS total_output_tokens,
    date_bin('1 minute'::INTERVAL, "timestamp") AS time_window
FROM opentelemetry_traces
WHERE "span_attributes.gen_ai.system" IS NOT NULL
GROUP BY "span_attributes.gen_ai.request.model", time_window;
The demo defines three Flows: token usage, latency distribution (via uddsketch quantile sketches), and request counts by model and status code. Need p95 latency? Query the rollup table instead of scanning raw traces:
sql
SELECT model,
    ROUND(uddsketch_calc(0.50, duration_sketch) / 1000000, 1) AS p50_ms,
    ROUND(uddsketch_calc(0.95, duration_sketch) / 1000000, 1) AS p95_ms
FROM genai_latency_1m
ORDER BY time_window DESC LIMIT 20;
Full write-up: One Database for LLM Observability: Traces, Metrics, and Conversations.
Agent-friendly docs and AI assistant
We're also making the docs themselves agent-friendly.
The docs site publishes llms.txt, following the llmstxt.org standard. It's a structured index that agents can read to find the right page without crawling the whole site.
The docs and homepage also have an Ask AI assistant. Type a question in plain English and get an answer grounded in the official documentation. Faster than browsing the sidebar when you're just getting started.
Why GreptimeDB
None of this is bolted on. It follows from how GreptimeDB is built.
Metrics, logs, and traces are all timestamped wide events stored in a single columnar engine. GenAI traces, token metrics, and conversation logs don't need three backends. One database, one SQL query to correlate them. That's the Observability 2.0 idea.
Agents generate SQL naturally, and existing Prometheus dashboards keep running on PromQL. Both query the same data.
Primary storage sits on S3, GCS, or Azure Blob, with compute and storage decoupled. LLM observability data grows fast (conversation logs especially), and object storage costs a fraction of local disks. On the protocol side, OTLP, Prometheus Remote Write, and InfluxDB Line Protocol all work natively, so OTel-instrumented LLM apps send data straight in with no adapter layer.
GreptimeDB also runs on ARM edge devices. If your agents live at the edge (common in IoT), observability data stays local.
Try it
- Install the MCP Server:
pip install greptimedb-mcp-server - Install Agent Skills:
npx skills add https://github.com/GreptimeTeam/docs/tree/main/skills/greptimedb-pipeline - Run the GenAI Observability demo:
docker compose --profile load up -d - Try Ask AI on the docs site
Up next: more Agent Skills (including best-practice rules), better Markdown docs for agent consumption, and broader analysis coverage in the MCP Server.
References
- GreptimeDB MCP Server
- GreptimeDB Agent Skills
- GenAI Observability Demo
- GreptimeDB llms.txt
- Bridging Databases and LLMs — GreptimeDB MCP Introduction
- GreptimeDB MCP Server v0.3 Release
- One Database for LLM Observability
- Observability 2.0 and the Database for It
- Agent Skills Open Standard
- OpenTelemetry GenAI Semantic Conventions


