On this page
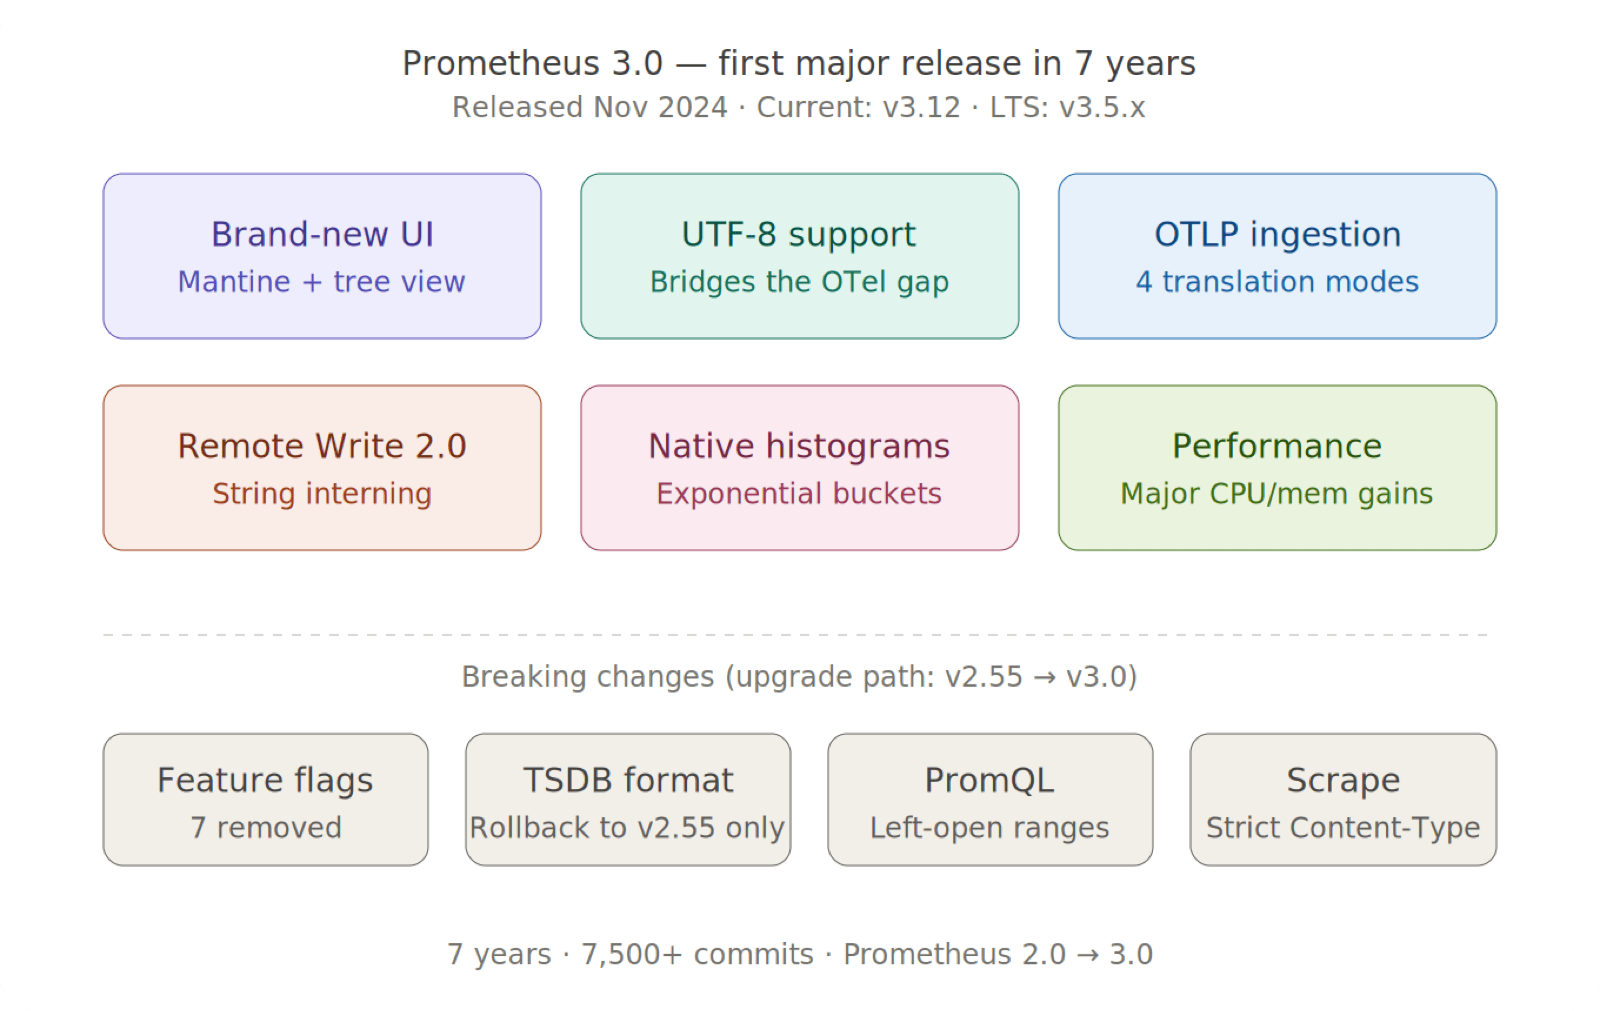
Prometheus 3.0 shipped in November 2024 — the first major version since 2.0 in 2017. Over seven years and 7,500 commits, Prometheus evolved from an early adopter tool into the standard cloud-native monitoring stack. During that time, several changes accumulated that could not ship as minor releases: default UTF-8 support, a new wire protocol, and a completely rewritten UI. These required a major version boundary.
This article covers every notable change in Prometheus 3.0 and explains how GreptimeDB has adapted to remain compatible as a drop-in Prometheus backend.
Why a Major Version?
Prometheus 2.0 rewrote the storage engine (TSDB). Since then, the project shipped incremental improvements every six weeks without breaking backward compatibility.
But some changes cannot land as minor bumps — enabling UTF-8 by default, deprecating the old UI, introducing a new Remote Write protobuf message. The project also needed to clean up a pile of deprecated feature flags. That cleanup requires a major version, and 3.0 is the result.
Brand-New UI
The most visible change. The old web UI was built on an outdated Bootstrap version, cluttered with five years of ad-hoc additions. The new one uses Mantine (a modern React-based component framework) and adds features that previously required separate tools.
What's new:
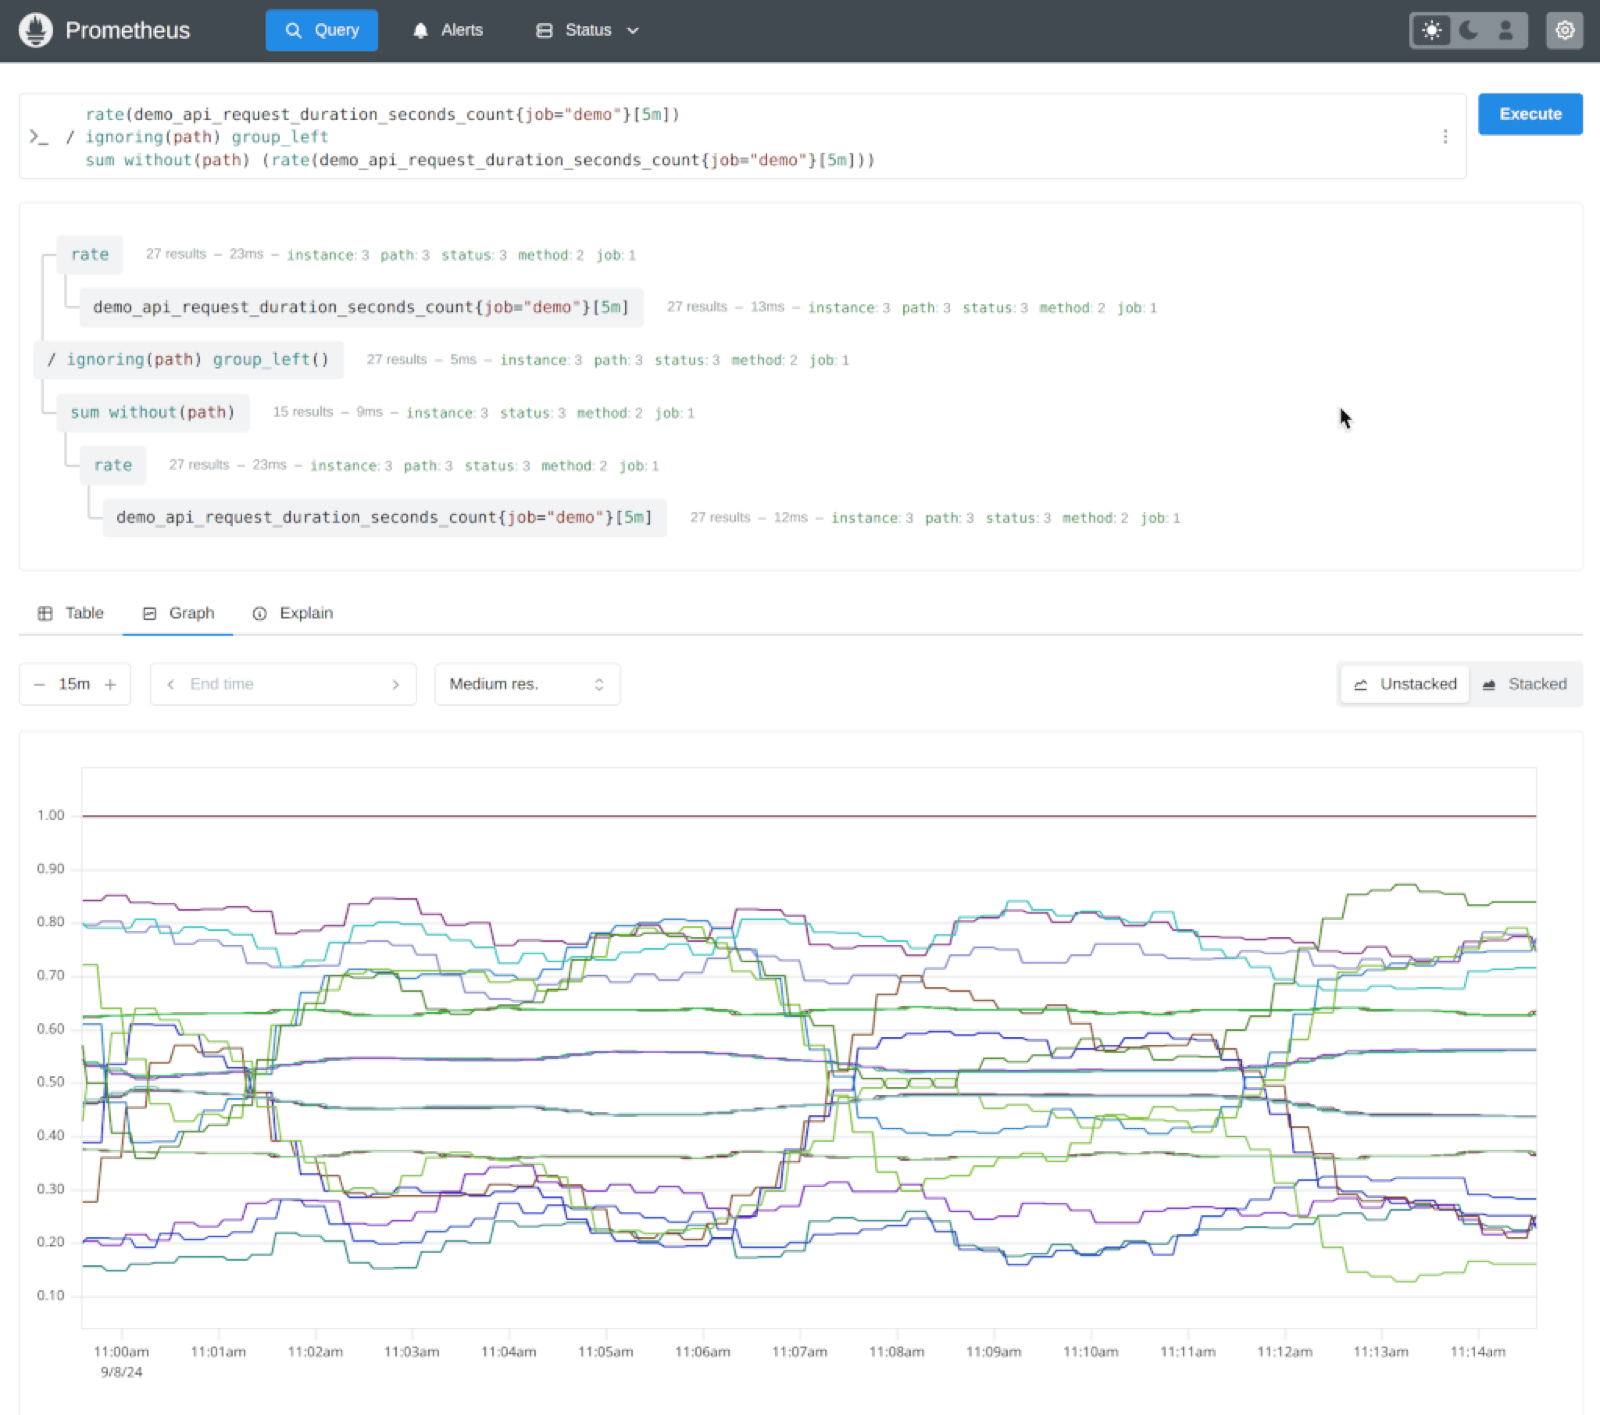
- PromLens-style tree view — visualize PromQL as a tree of sub-expressions with per-node hover results. Previously this required the standalone PromLens tool.
- Metrics explorer — browse metrics with contextual info, much richer than the old plain list.
- Explain tab — behavioral insights about query results, directly in the UI.
- UTF-8 display — metric names with dots, dashes, and non-ASCII characters render correctly.
The new UI still lacks exemplar display and heatmap support in the initial 3.0 release. If you need those, the old UI remains available via --enable-feature=old-ui.
UTF-8 Support: Bridging the OTel Gap
This is arguably the most impactful change for the broader observability ecosystem.
Before 3.0, Prometheus restricted metric and label names to [a-zA-Z_:][a-zA-Z0-9_:]*. OpenTelemetry uses dots extensively in its semantic conventions — http.server.duration, system.cpu.utilization, db.client.connections.usage. When OTel metrics entered Prometheus, dots were converted to underscores. You would instrument with http.server.duration but have to query http_server_duration — a confusing disconnect between what your SDK reported and what was actually queryable.
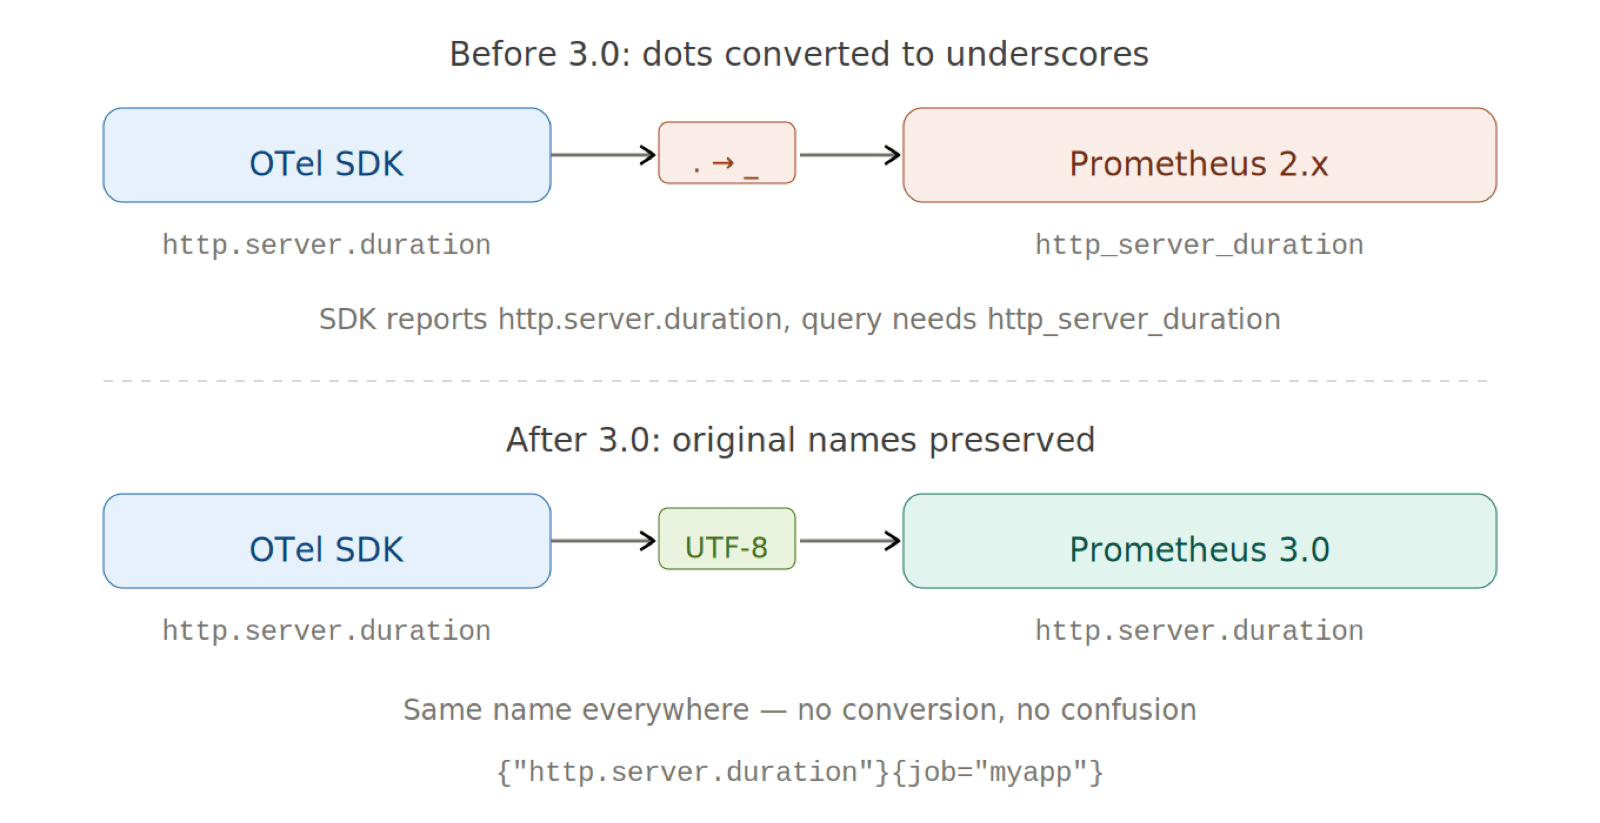
Prometheus 3.0 accepts all valid UTF-8 characters by default. PromQL adds quoting syntax for these names:
promql
# Legacy names still work
http_server_duration_seconds_bucket{job="myapp"}

# OTel metrics with original dot notation
{"http.server.duration"}{job="myapp"}

# Explicit __name__ label
{__name__="http.server.duration", job="myapp"}
For backward compatibility with older tooling, you can enforce legacy validation per scrape job:
yaml
# prometheus.yml
scrape_configs:
  - job_name: legacy-app
    metric_name_validation_scheme: legacy
  - job_name: otel-app
metric_name_validation_scheme: utf8Note: As of 3.0, only the Go client library (
client_golang) fully supports emitting UTF-8 metric names. Other language SDKs are catching up.
Remote Write 2.0: Formalizing the Wire Protocol
Remote Write is how Prometheus pushes metrics to external storage — Thanos, Cortex, Mimir, GreptimeDB, and others. The 1.0 spec was published in April 2023, formalizing a protocol that dozens of implementations had already been using for years.
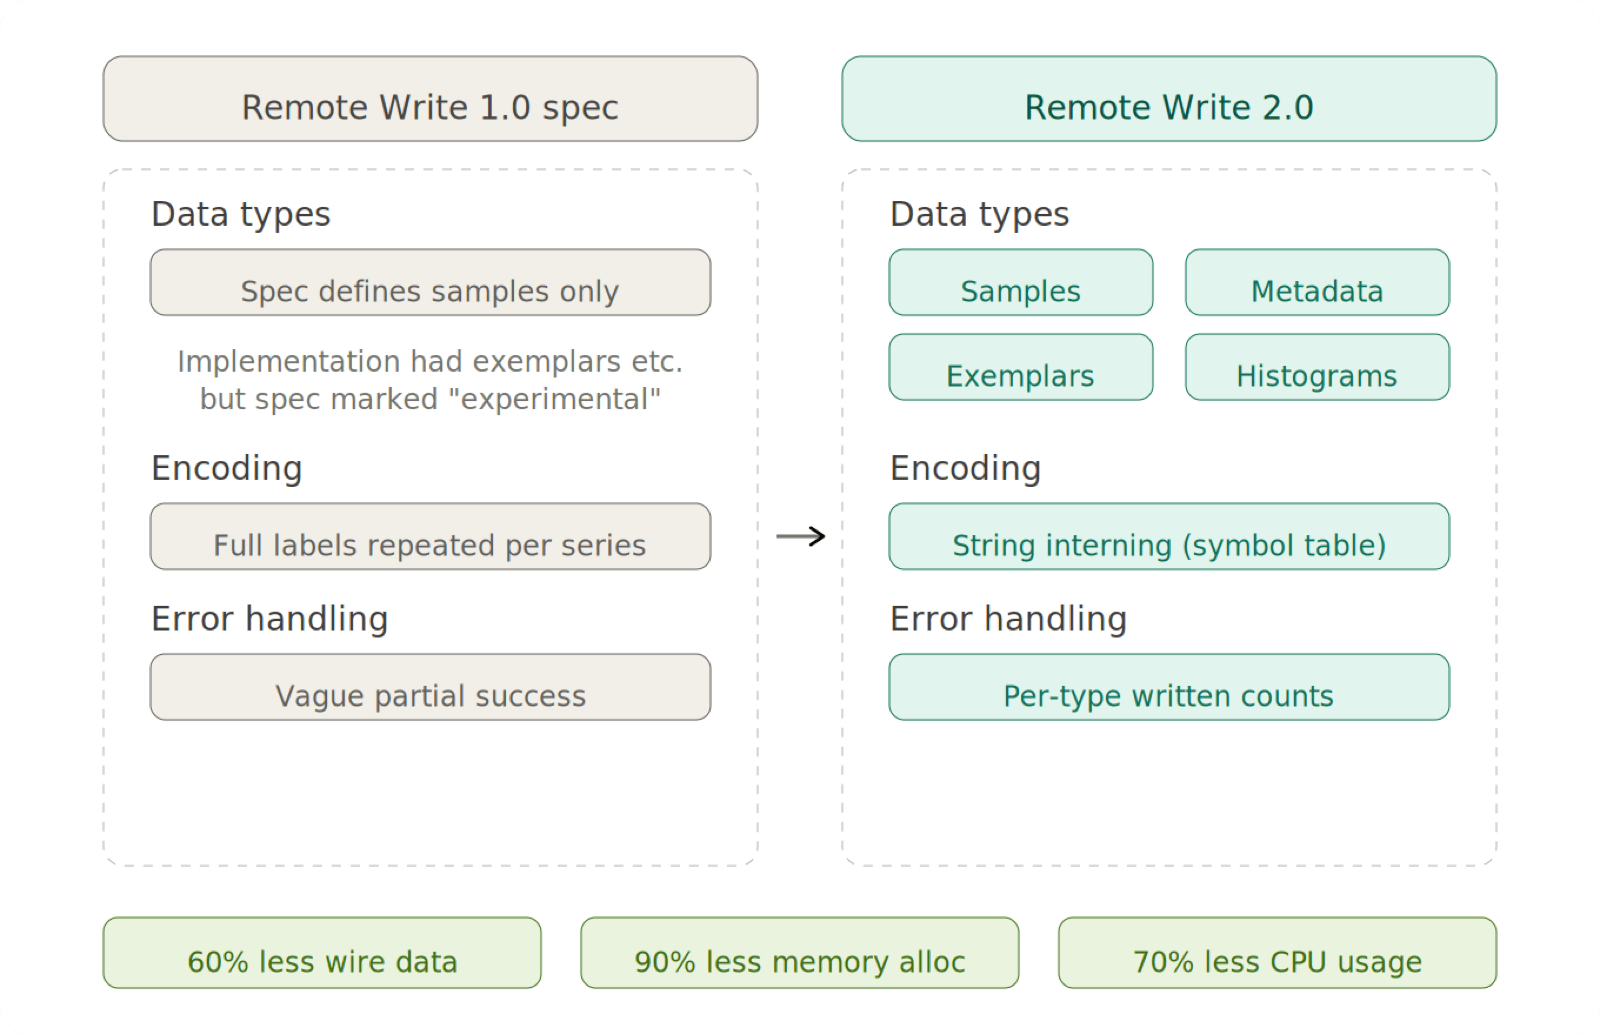
There is an important nuance here. The 1.0 specification defined a minimal proto: TimeSeries with just labels + samples. But Prometheus's actual implementation (prompb/types.proto) had already gone further — the real prometheus.WriteRequest proto included exemplars (field 3 in TimeSeries), histograms (field 4), and MetricMetadata (field 3 in WriteRequest). The 1.0 spec called these "experimental" and "out of scope," noting: "Prometheus currently has experimental support for sending metadata and exemplars."[1]
Remote Write 2.0 formalizes all of this. It introduces io.prometheus.write.v2.Request — a new protobuf message that officially specifies every data type — and adds string interning, the single biggest performance improvement.
What 2.0 changes
String interning: Each unique string is stored once in a symbols array; subsequent references use integer indices. Benchmarks from KubeCon NA 2024[2] show 60% fewer bytes on the wire, 90% fewer memory allocations, and 70% lower CPU usage during compression/decompression.
Formalized data types: Exemplars and metadata existed in the 1.0 proto implementation but lacked a formal contract. RW 2.0 specifies the full set:
- Metadata (type, help, unit) — embedded per-TimeSeries instead of a separate array
- Exemplars — with required timestamps for reliable deduplication
- Created timestamps — when a counter was initialized, enabling accurate
rate()across restarts - Native histograms — the exponential-bucket histogram type (see next section)
Partial write handling: Precise response headers tell senders exactly what was written:
X-Prometheus-Remote-Write-Samples-Written: 42
X-Prometheus-Remote-Write-Histograms-Written: 10
X-Prometheus-Remote-Write-Exemplars-Written: 5
Native Histograms
Classic Prometheus histograms require pre-defined bucket boundaries (le values). Choose them poorly and you lose resolution where it matters. Change them and you break existing dashboards.
Native histograms use exponential-growth boundaries determined by a schema parameter. You pick a resolution level; boundaries are calculated automatically. One series replaces N bucket series, and out-of-order ingestion is supported (important for OTel data and network-gap scenarios).
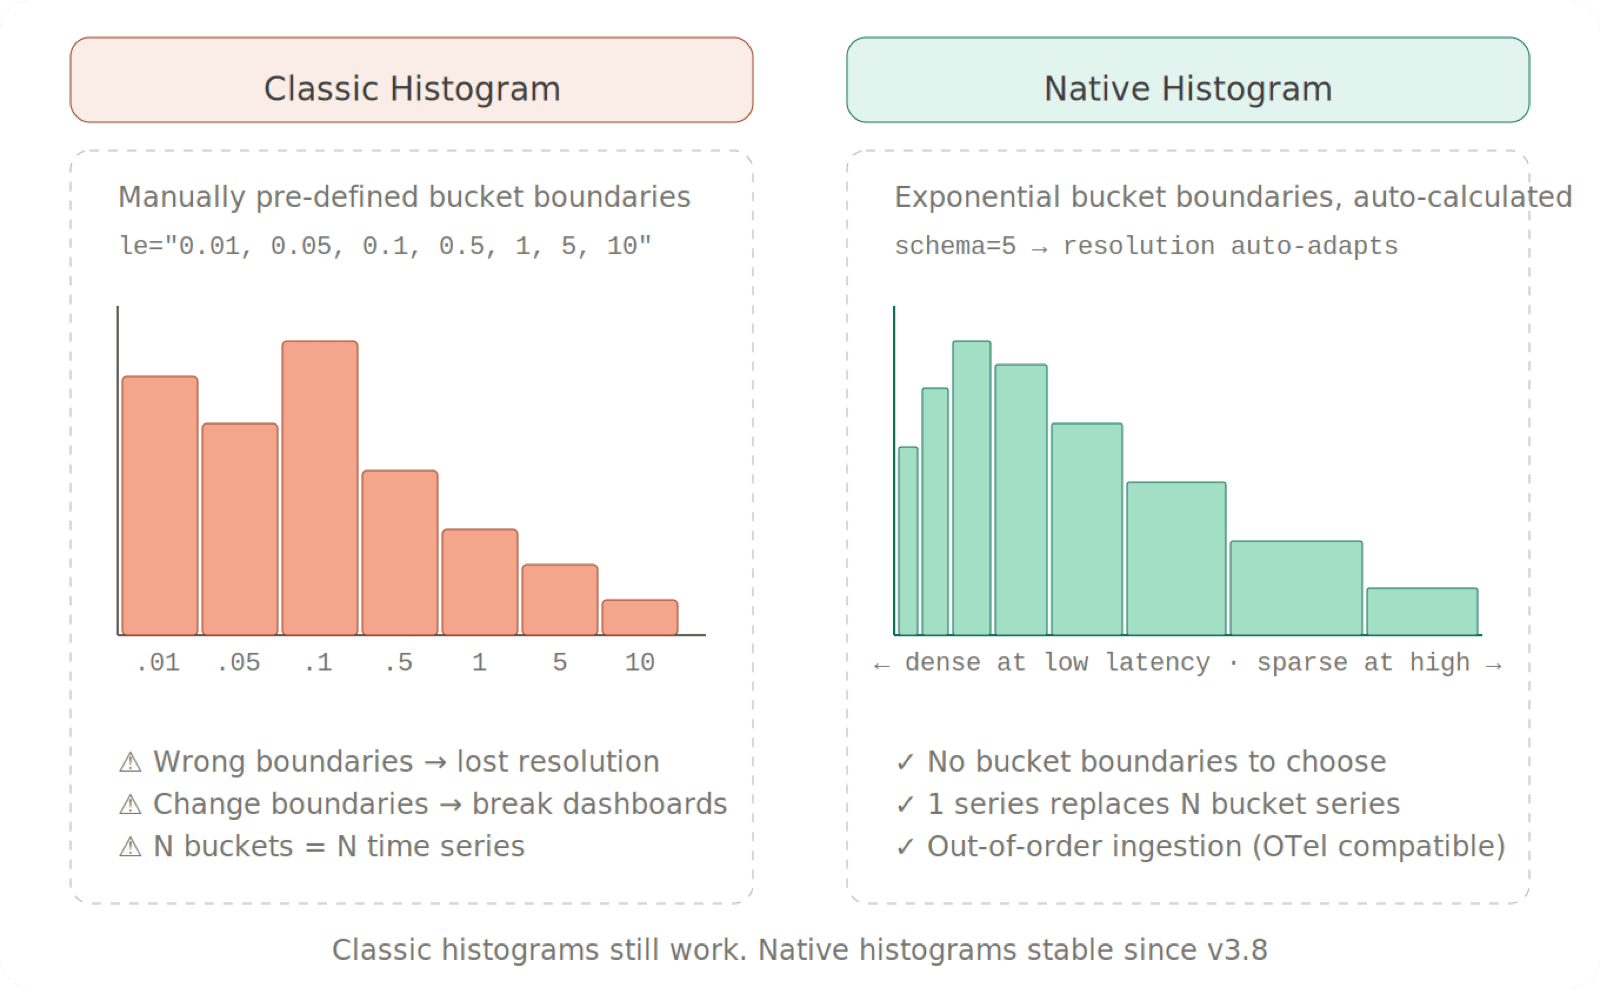
Native histograms reached stable status in Prometheus v3.8 (November 2025)[3], but scraping still requires explicit opt-in:
yaml
scrape_configs:
  - job_name: my-app
    scrape_native_histograms: true
From v3.9 onward, the old --enable-feature=native-histograms flag is a no-op.
Note: The text exposition format and some accessor functions for native histograms are still being designed. Classic histograms continue to work unchanged.
Also in 3.0: holt_winters() is renamed to double_exponential_smoothing() and moved behind the experimental-promql-functions feature flag.
Native OTLP Ingestion
Prometheus 3.0 can receive OTLP metrics directly — no Collector needed as an intermediary.
bash
prometheus --web.enable-otlp-receiverThis exposes /api/v1/otlp/v1/metrics. Point any OTel SDK at it:
bash
export OTEL_EXPORTER_OTLP_PROTOCOL=http/protobuf
export OTEL_EXPORTER_OTLP_METRICS_ENDPOINT=http://localhost:9090/api/v1/otlp/v1/metrics
export OTEL_TRACES_EXPORTER=none
export OTEL_LOGS_EXPORTER=none
Four translation strategies control how OTLP metric names map to Prometheus:
| Strategy | What it does | When to use |
|---|---|---|
UnderscoreEscapingWithSuffixes | Dots → underscores + type/unit suffixes | Default; existing Prometheus stacks |
UnderscoreEscapingWithoutSuffixes | Dots → underscores, no suffixes | Rarely; risk of collisions |
NoUTF8EscapingWithSuffixes | Keeps dots + adds suffixes | New stacks with UTF-8 support |
NoTranslation | No changes | Full OTel fidelity |
yaml
otlp:
  translation_strategy: NoUTF8EscapingWithSuffixes
  promote_resource_attributes:
    - service.instance.id
PromQL Behavior Changes
Left-open range selectors
Range selectors are now left-open, right-closed (previously left-closed, right-closed):
Prometheus 2.x: metric[5m] at T → samples in [T-5m, T]
  Might return 6 samples if boundary aligns perfectly

Prometheus 3.x: metric[5m] at T → samples in (T-5m, T]
  Always returns 5 samples with even spacing
This primarily affects subqueries, where evaluation timestamps are naturally aligned with resolution multiples.
Regex dot matching
. now matches all characters including \n. To preserve the old behavior, use [^\n] instead:
promql
my_metric{label=~"foo[^\n]*"}Performance
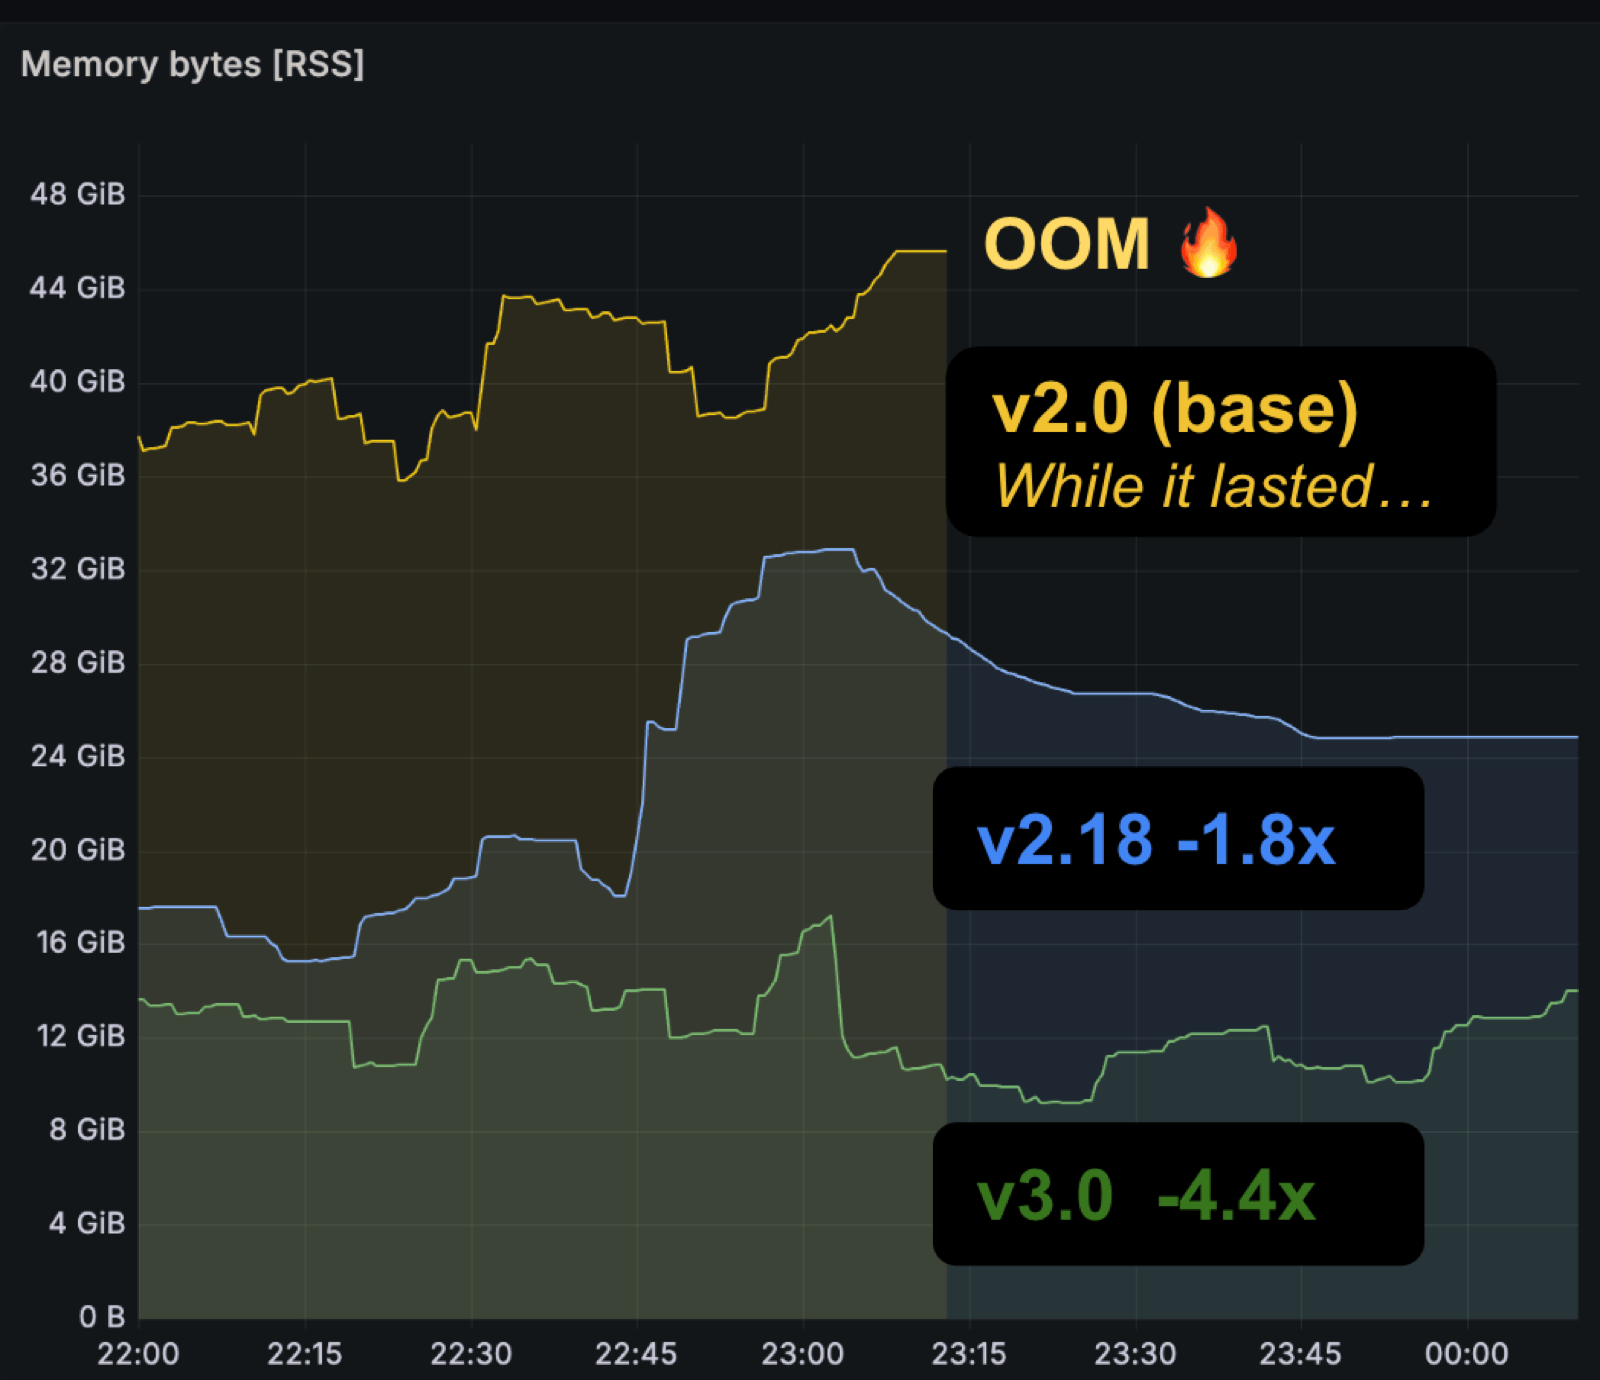
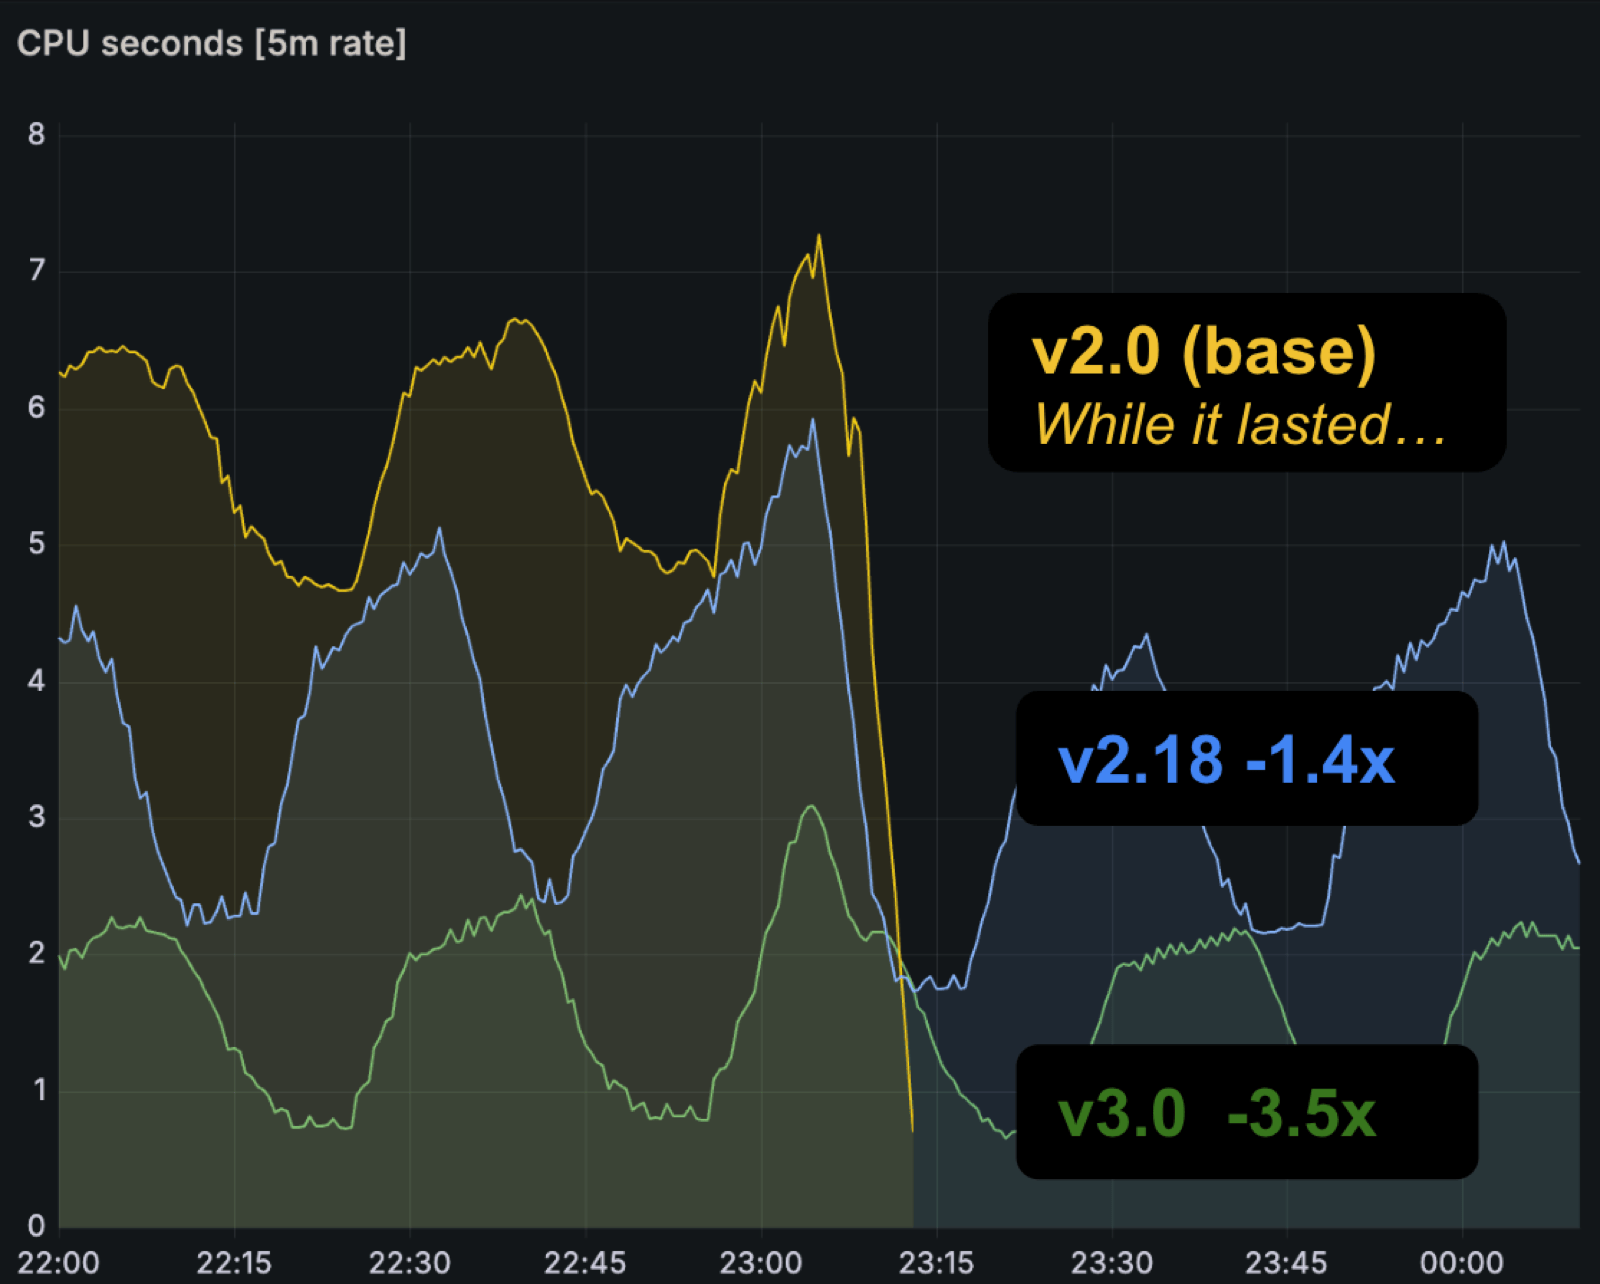
Prometheus 3.0 delivers clear efficiency gains. On benchmark nodes (8 CPUs, 49 GB memory) running the same queries and configs via the prombench macrobenchmark[4], both memory and CPU usage dropped meaningfully compared to 2.0 and intermediate versions.
Other optimizations include GOMAXPROCS and GOMEMLIMIT auto-matching container limits (disable with --no-auto-gomaxprocs / --no-auto-gomemlimit), and a new Service Discovery manager that skips unchanged discoveries on reload.
Migration: What Breaks
Breaking changes are small but real.
Upgrade path: Go to v2.55 first, verify everything works, then upgrade to v3.0. Rollback from 3.0 only works back to v2.55 — the TSDB index format changed.
Key changes:
- Seven feature flags removed (now default behavior):
utf8-name,native-histograms,agent,remote-write-receiver,promql-at-modifier,promql-negative-offset,new-service-discovery-manager - Invalid/missing Content-Type on scrape targets fails the scrape; set
fallback_scrape_protocolif needed - Scrape target ports no longer auto-added/removed
- Log format switched to Go's
log/slog - Alertmanager v0.16.0+ required (v1 API dropped)
- Kubernetes SD dropped
v1beta1for EndpointSlice and Ingress
Full details: migration guide.
GreptimeDB and Prometheus 3.0
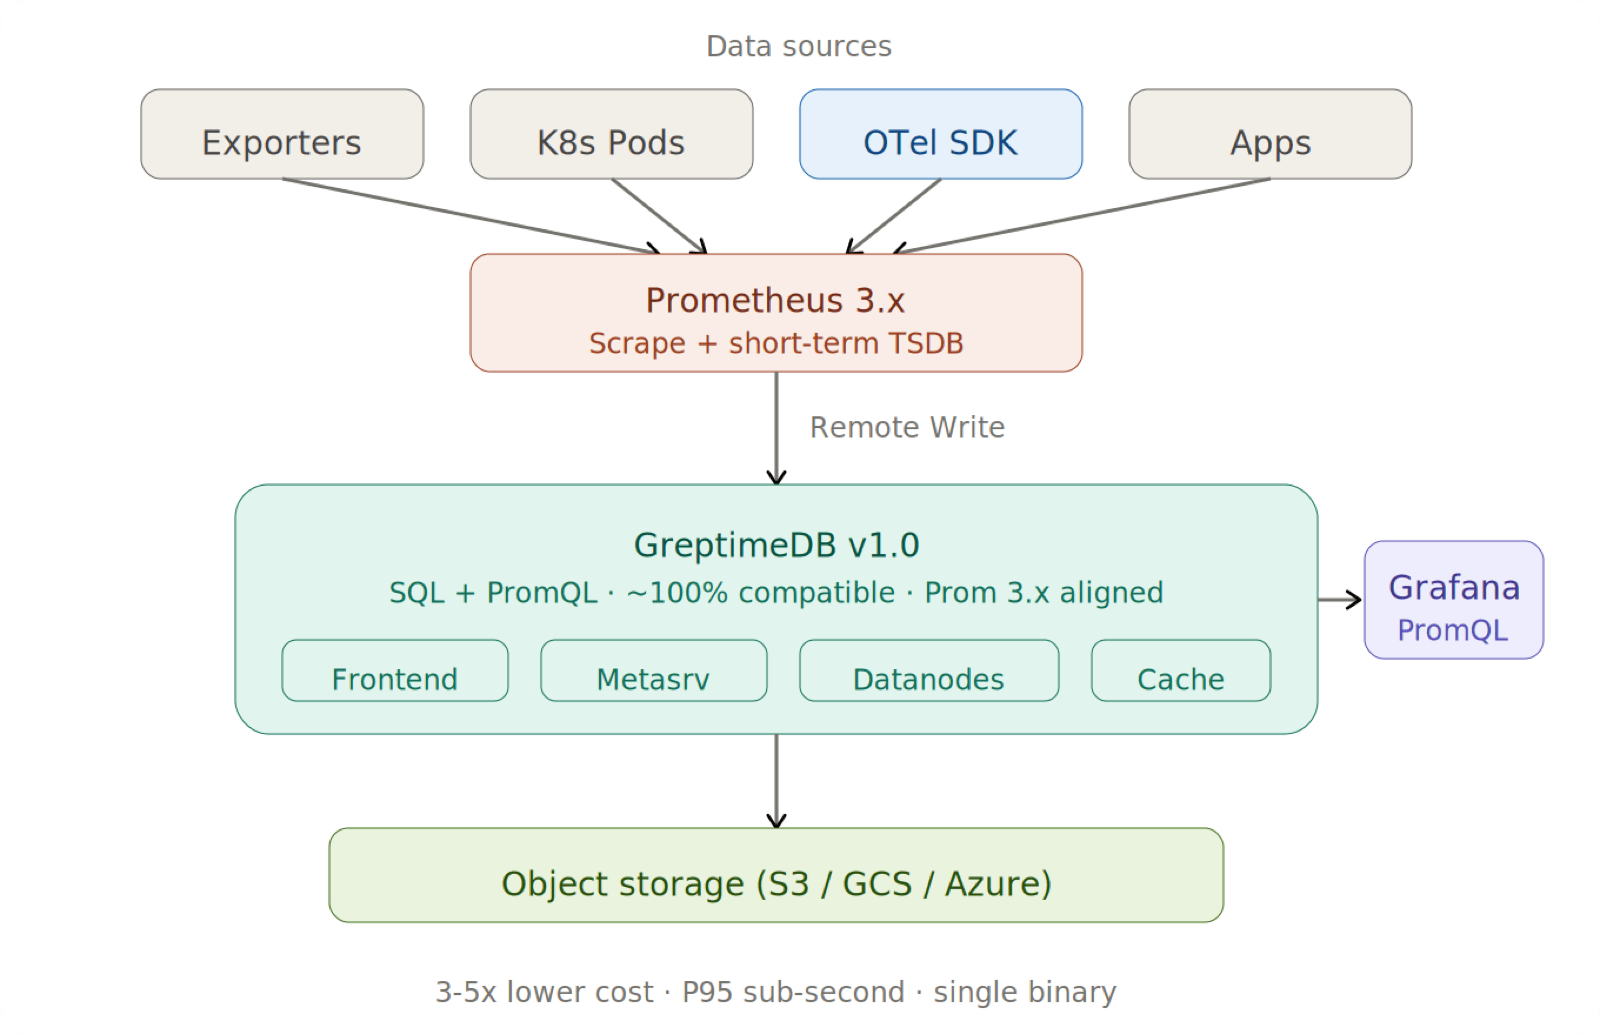
GreptimeDB is an open-source observability database that works as a drop-in Prometheus backend — accepting Remote Write, serving PromQL via the Prometheus HTTP API, and acting as long-term storage. With Prometheus 3.0 changing core query and protocol behaviors, GreptimeDB has adapted systematically.
PromQL Compliance
GreptimeDB implements PromQL in Rust — its own parser (promql-parser) and execution engine built on Apache DataFusion, not a wrapper around Go code.
At PromCon EU 2025, GreptimeDB engineer Ruihang Xia shared[5] that on the PromLabs compliance test suite, GreptimeDB scored highest among all tested implementations outside Prometheus itself — higher even than implementations that import Prometheus's Go modules directly. The public tracking issue[6] documents the journey from 13% (February 2023) to over 82% at the time of the talk. Since then, GreptimeDB has continued closing the remaining gaps and now passes close to 100% of the official PromQL compliance test suite.
For Prometheus 3.0 specifically, GreptimeDB v1.0.0-rc.2 shipped these adaptations[7]:
- Left-open range selectors (PR #7671) — aligned with 3.x matrix selector semantics
- Start-exclusive instant selectors (PR #7688) — fixed lookback handling for end bounds
- Function rename (PR #7700) —
holt_winters→double_exponential_smoothing - Parser upgrade —
promql-parserv0.7.0 added Prometheus 3 support (string identifiers and Unicode label names)[8]; v0.7.1 declared compatibility with Prometheus v3.8 in the README[9]
Remote Write Support
GreptimeDB supports Prometheus Remote Write 1.0, including the sample, metadata, and histogram fields in the prometheus.WriteRequest proto. Exemplar ingestion is not yet supported and is on the roadmap.
yaml
# prometheus.yml
remote_write:
  - url: http://<greptimedb-host>:4000/v1/prometheus/write
remote_read:
  - url: http://<greptimedb-host>:4000/v1/prometheus/read
Remote Write 2.0 support (the new io.prometheus.write.v2.Request message with string interning) is tracked in GitHub Issue #4765[10], with the goal of adding 2.0 while keeping 1.0 fully functional.
GreptimeDB has also optimized Remote Write decode performance (PRs #7737, #7761) and supports three UTF-8 validation modes[11]: strict (default, rejects invalid UTF-8), lossy (replaces invalid chars with U+FFFD), and unchecked (no validation, maximum throughput).
Why GreptimeDB Behind Prometheus?
Prometheus's TSDB targets short-term retention (default 15 days). For longer horizons — anomaly detection training, compliance, trend analysis — external storage is needed.
Thanos and Cortex work but add operational overhead: Sidecar, StoreGateway, Compactor — multiple components to deploy and monitor.
GreptimeDB takes a different approach:
- Single binary, one Helm chart — no multi-component orchestration
- Object storage as primary — S3, GCS, or Azure Blob at 3–5× lower cost than block storage
- SQL + PromQL on the same data — PromQL for dashboards, SQL for ad-hoc analysis and JOINs
- Close to 100% PromQL compliance — existing Grafana dashboards work after an endpoint switch
- Unified observability — metrics, logs, and traces in one database via OTLP and Loki protocols
A typical deployment:
bash
helm repo add greptime https://greptimeteam.github.io/helm-charts

helm upgrade --install prom-lts greptime/greptimedb-cluster \
  --set 'meta.backendStorage.etcd.endpoints[0]=etcd.etcd-cluster.svc.cluster.local:2379' \
  --set objectStorage.s3.bucket="prom-data" \
  --set objectStorage.s3.region="us-west-2" \
  --set objectStorage.s3.root="prom-lts" \
  --set objectStorage.credentials.accessKeyId="<your-access-key-id>" \
  --set objectStorage.credentials.secretAccessKey="<your-secret-access-key>" \
  -n observability
yaml
remote_write:
  - url: http://prom-lts-frontend:4000/v1/prometheus/write
remote_read:
  - url: http://prom-lts-frontend:4000/v1/prometheus/read
No code changes, no new query language — just scalable, durable retention.
What's Next
The community roadmap after 3.0 includes:
- Native histogram custom buckets and continued stabilization
- Delta temporality for counters
- OpenMetrics 2.0, now under Prometheus governance
- Start timestamp storage (experimental in v3.11+)
- UTF-8 SDK support beyond Go
As of May 2026, Prometheus is at v3.12 (latest) with the LTS at v3.5.x (supported through July 2026).
What to Do Now
- Read the migration guide — especially the TSDB format change and the v2.55 stepping stone
- Audit your PromQL for
.regex patterns that relied on newlines being excluded - If you run GreptimeDB behind Prometheus, upgrade to v1.0+ for Prometheus 3.x selector alignment
References
Prometheus Remote Write 1.0 Specification — "Prometheus currently has experimental support for sending metadata and exemplars" ↩︎
Remote Write 2.0 at KubeCon NA 2024 — 60% message reduction, 90% memory reduction, 70% CPU reduction ↩︎
Prometheus Native Histograms Spec — "Starting with v3.8.0, native histograms are supported as a stable feature" ↩︎
Announcing Prometheus 3.0 — Performance benchmarks ↩︎
promql-parser README — "compatible with prometheus v3.8" ↩︎
GreptimeDB Config Reference — UTF-8 validation modes ↩︎


