On this page
GreptimeDB Dashboard now ships with built-in dashboards powered by the Perses project. With the GreptimeDB plugin merged into CNCF's official Perses plugins repository, the Perses ecosystem now supports GreptimeDB as a native data source.
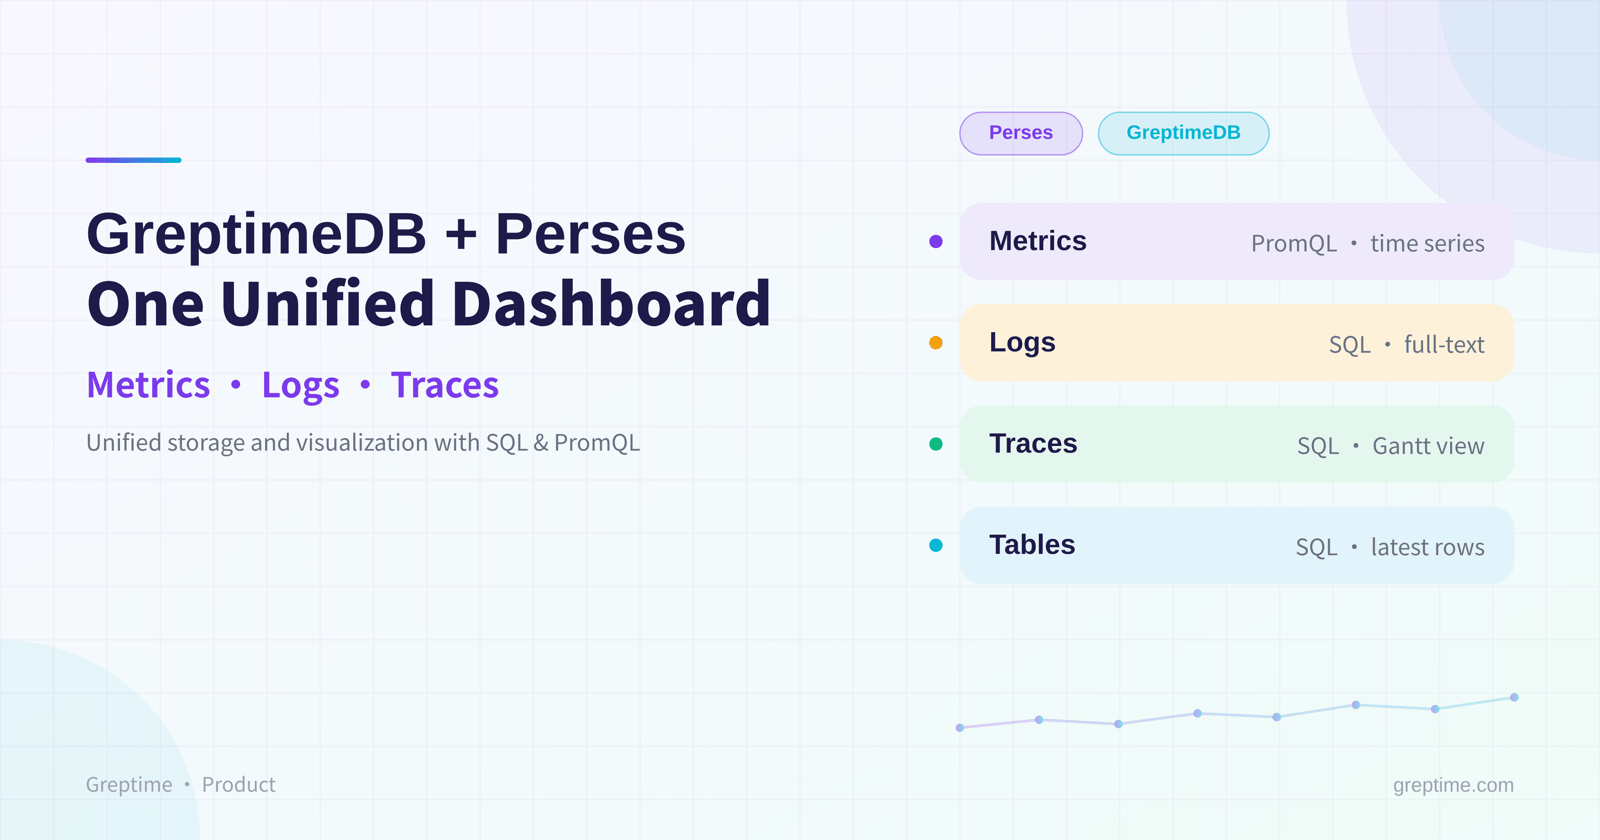
Through this deep integration with Perses, GreptimeDB's backend capability as The Single Database for Observability extends all the way to the frontend, giving you a single, unified dashboard view.
What is Perses
If you've used Grafana, Perses will feel familiar: it solves the same class of problem, but takes a cloud-native approach.
Perses is a CNCF Sandbox project, accepted into the CNCF in August 2024. It was originally open-sourced by Amadeus in 2022 under the Apache 2.0 license. In the CNCF observability ecosystem, collection is covered by OpenTelemetry and storage and querying by Prometheus, but visualization long lacked a vendor-neutral standard. That gap is what Perses sets out to fill.
What sets Perses apart from traditional dashboard tools is that it treats dashboards as code (Dashboard-as-Code): dashboard definitions can live in version control and CI/CD, backed by the percli command-line tool and SDKs in both Go and CUE. Perses is also Kubernetes-native, so you can declare dashboards as CRDs and ship them alongside your applications, which fits GitOps workflows naturally. Data sources follow a plugin design: Prometheus, Tempo, Loki, Pyroscope, and others connect through plugins, and you can write your own. The GreptimeDB data source is one of them.
Why GreptimeDB + Perses
1. A unified observability dashboard
GreptimeDB stores and analyzes metrics, logs, and traces in one place. With Perses carrying the dashboards, that unified backend extends to the frontend: you view and analyze multimodal data from a single entry point, which is lighter and more intuitive than juggling several tools.
2. A native SQL query engine that unlocks multimodal data
The GreptimeDB plugin is a standard SQL query engine that lets you explore multimodal data with one language. Whether you're running time-series aggregations on metrics with GreptimeDB's time-window functions or joining across log and trace details, a single SQL plugin covers it.
3. SQL and PromQL, each doing what it does best
In day-to-day dashboard configuration, the GreptimeDB plugin and the native Prometheus plugin divide the work cleanly:
- Metrics go through PromQL: configure a standard Prometheus data source and keep your existing PromQL syntax, reusing familiar cloud-native dashboard habits.
- Logs, traces, and advanced aggregations go through SQL: switch to the GreptimeDB plugin and drill down with SQL and its time-series functions.
Capabilities at a glance
Migrating a Grafana Node Exporter dashboard
GreptimeDB is natively compatible with the Prometheus ecosystem: it supports high-throughput ingestion of Prometheus metrics and full PromQL querying. Thanks to this backend compatibility, and with the migration tool Perses provides, you can import a Grafana JSON config built on PromQL in one step. After import, dashboard variables, gauges, line charts, and the rest carry over seamlessly.
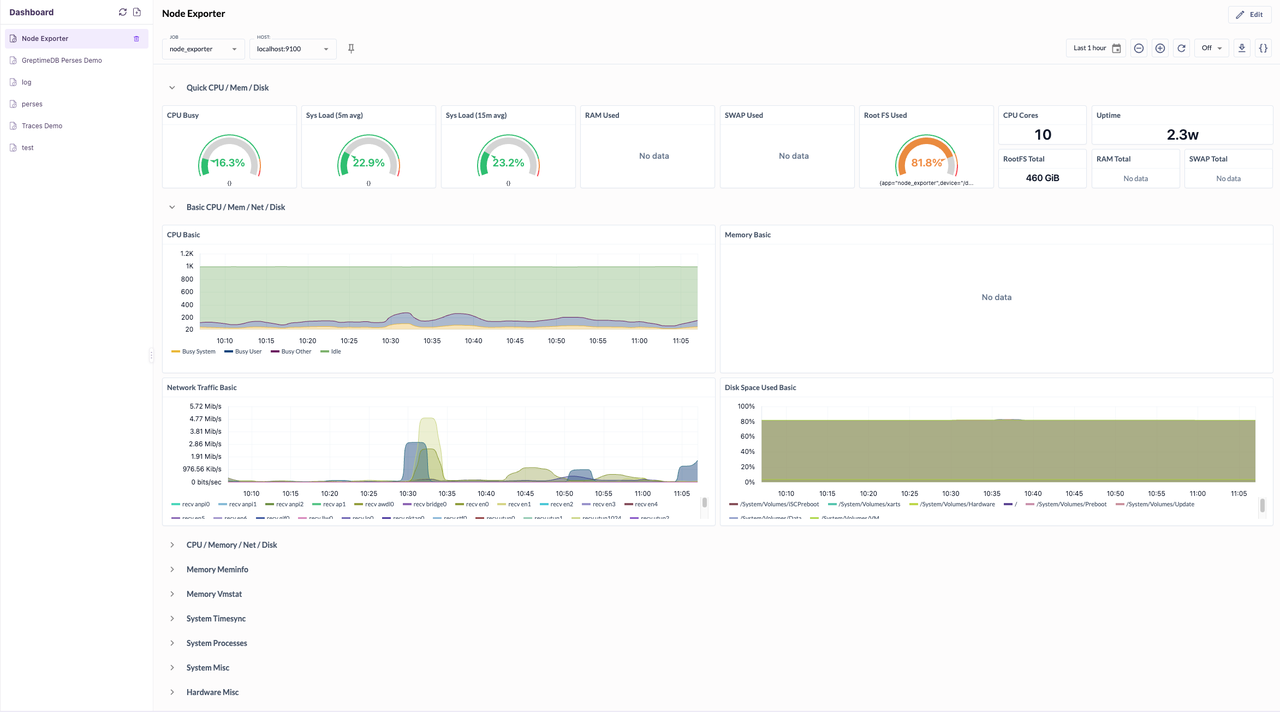
A Grafana Node Exporter dashboard imported into Perses
Time-series charts with SQL
To draw a line chart, use ${__from} and ${__to} to wire into the dashboard's time range (top-right corner):
sql
SELECT time_window, loc,
    max(max_temp) RANGE '1m' FILL LINEAR AS max_temp
  FROM public.temp_alerts
  WHERE time_window >= to_timestamp_millis(${__from})
    AND time_window <= to_timestamp_millis(${__to})
  ALIGN '30s' BY (loc)
  ORDER BY time_window ASC
  LIMIT 2000;
The built-in ${__from} and ${__to} variables pass millisecond timestamps, which pair with to_timestamp_millis() to match GreptimeDB's timestamp queries.
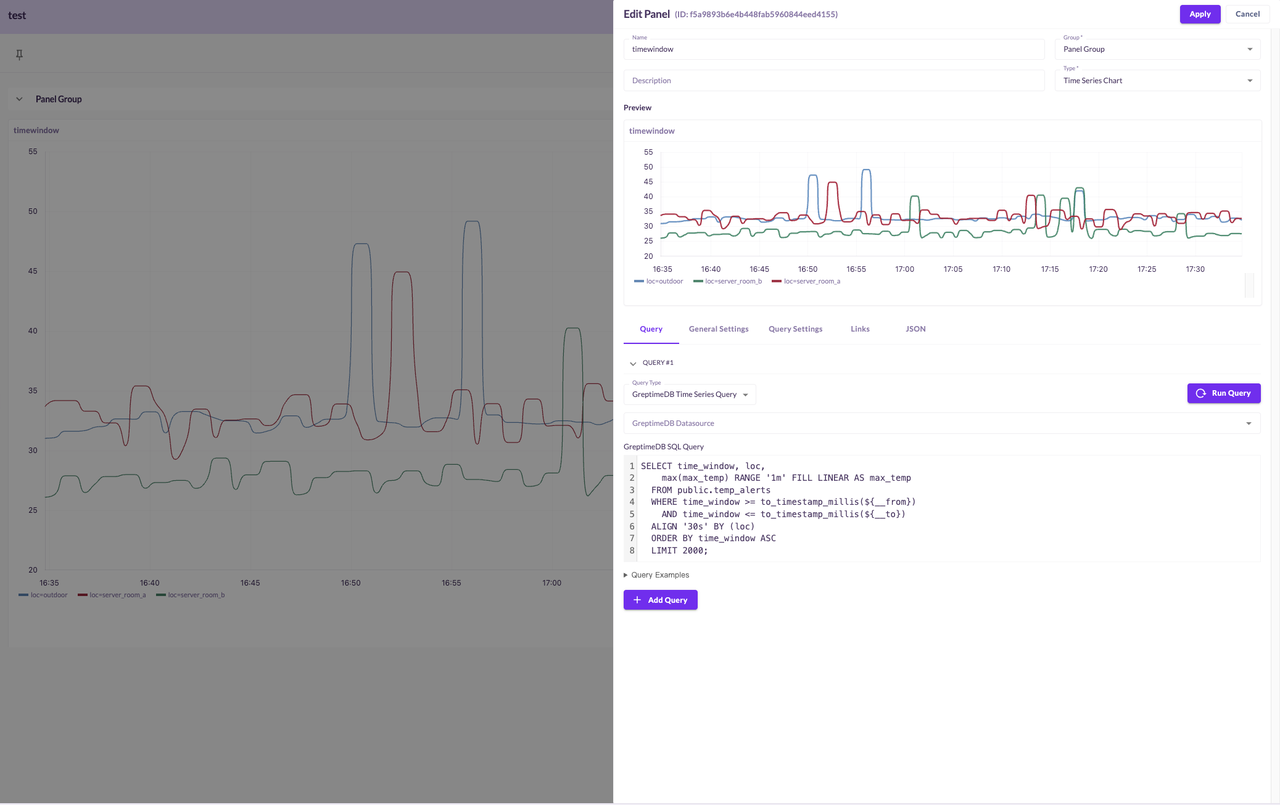
A CPU time-series line chart built with SQL
SQL tables
To see the latest records, switch the panel to Table while keeping the query type unchanged, then point the time column at your table's own time column:
sql
SELECT *
FROM public."penguins_size"
WHERE "greptime_timestamp" >= to_timestamp_millis(${__from})
  AND "greptime_timestamp" <= to_timestamp_millis(${__to})
ORDER BY "greptime_timestamp" DESC
LIMIT 100;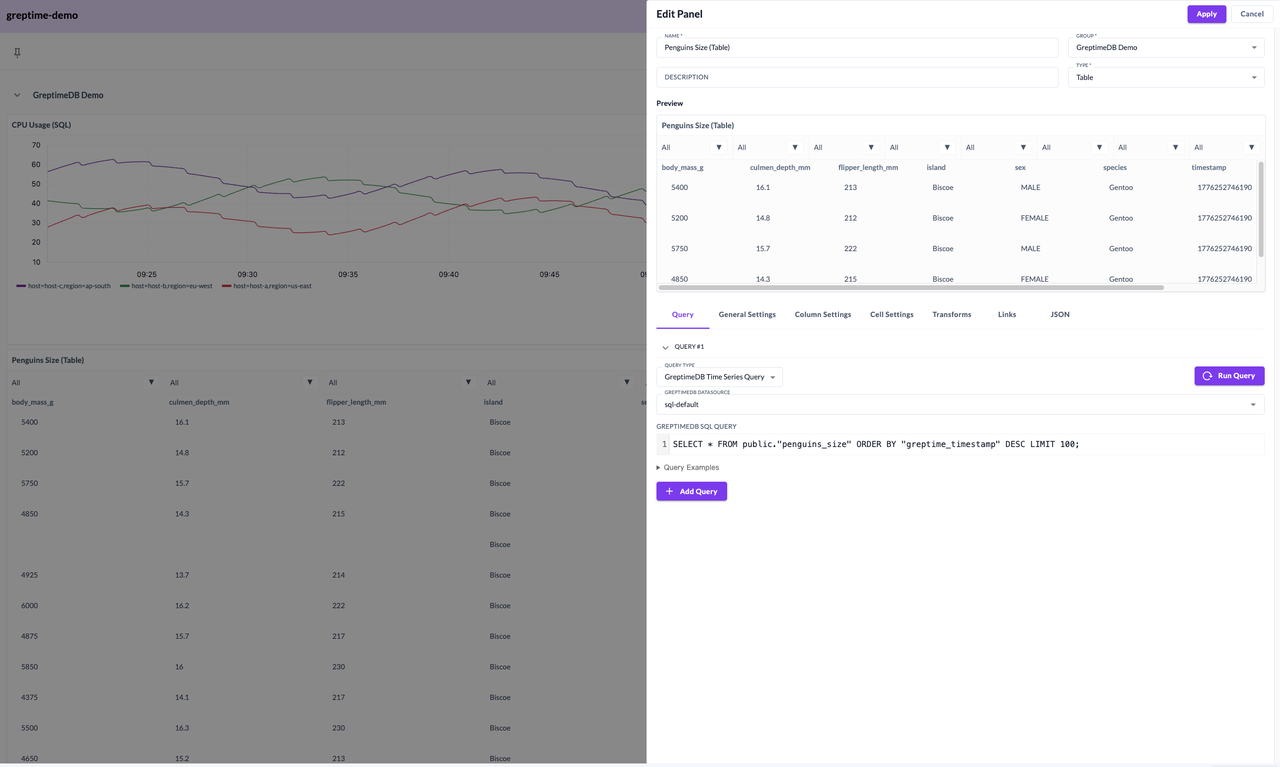
A SQL table panel showing the latest records
Logs panel
Use a Logs Table panel with a GreptimeDB Log Query.
Once you've set up variables for search, category, and so on at the top, reference custom variables like $search, $log_category, and $max_rows in your SQL, and limit the time window with ${__from} / ${__to}:
sql
SELECT ts, line_no, elapsed_s, step_s, content, message
FROM public.logtest
WHERE ts >= to_timestamp_millis(${__from})
  AND ts <= to_timestamp_millis(${__to})
  AND (content LIKE '%$search%' OR message LIKE '%$search%')
LIMIT $max_rows;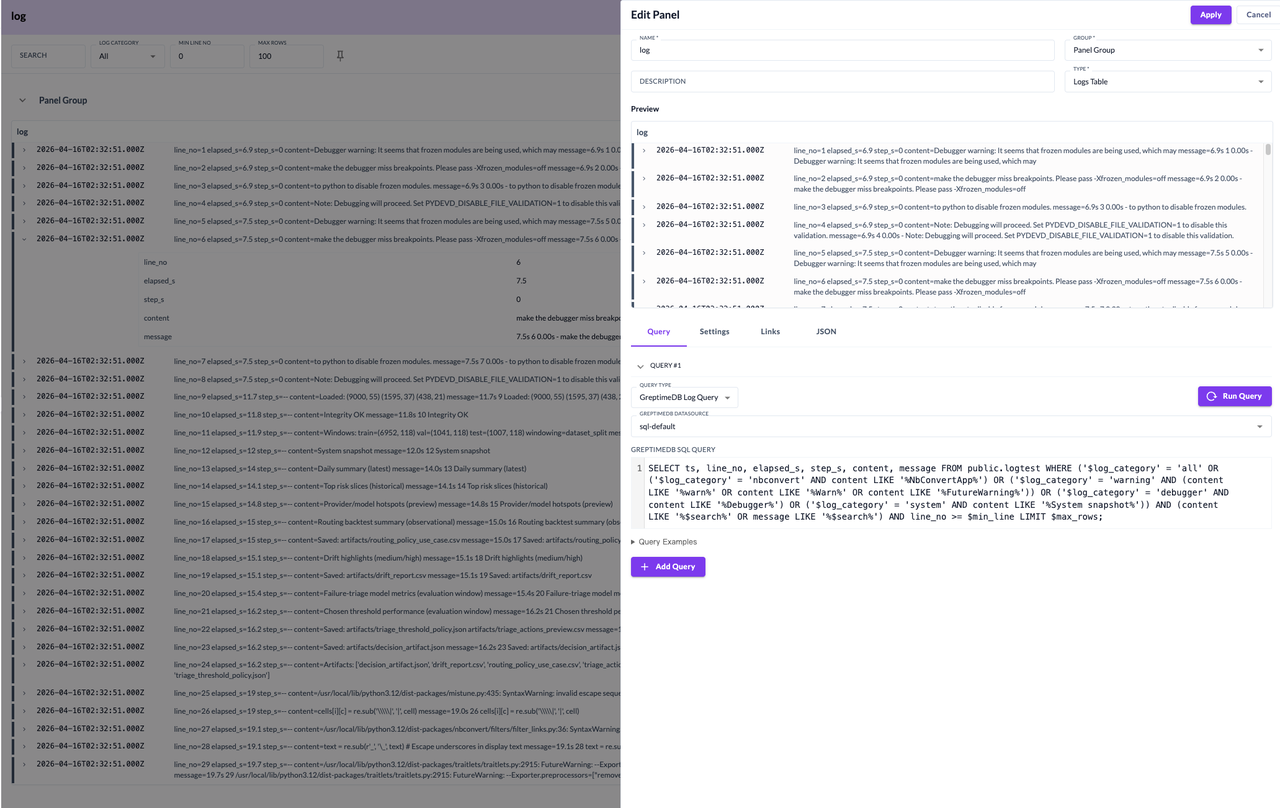
A Logs Table panel driven by a GreptimeDB Log Query
💡 Tip: For one-off troubleshooting, the Logs query view is faster. For a search view you check every day, save it into a Visualization dashboard.
Trace list
Choose a Trace Table panel with a GreptimeDB Trace Query. A single, simple SQL statement lists the root spans of your distributed calls, each one a complete trace:
sql
SELECT * FROM "public"."web_trace_demo" WHERE "parent_span_id" IS NULLClick any trace in the list, and the Gantt detail view opens on the right automatically. No extra drill-down query or sub-panel required.
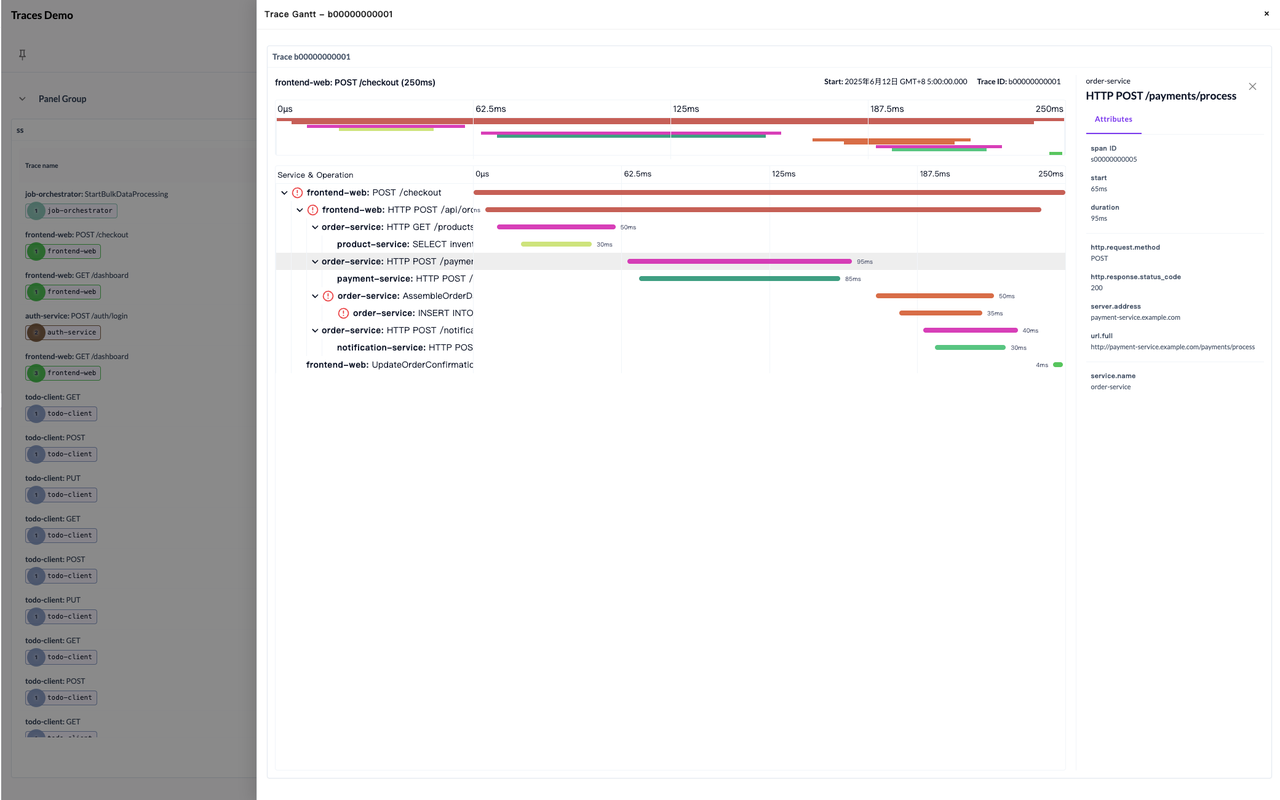
A Trace Table with the Gantt detail view open on the right
Summary
GreptimeDB stores metrics, logs, and traces together; Perses visualizes all of it in one place. Combine the two and you no longer maintain a sprawl of separate databases and dashboard tools: write your query (SQL or PromQL) in Greptime Dashboard's Visualization view, pick a panel, and watch metrics, logs, and traces from one spot.
Further reading: Perses migration guide


