
On this page

We released GreptimeDB v1.2.0-beta.1 on July 31, 2026. This is the first beta of v1.2.0 and it carries 4 breaking changes, so evaluate it in a test environment first. The main changes in this release:
- Support for the Prometheus Remote Write v2 protocol and native histograms
- JSON2 debuts as a data type; GA will come with the v1.2.0 stable release
- Query performance: dictionary-encoded series keys give roughly a 24% end-to-end improvement, and RangeSelect projection pruning cuts the columns scanned
- A round of permission and file-access hardening, including SQL local file sandboxing, which is a breaking change
- New Splunk HEC ingestion; cluster DDL and operational events now land in a system table
Development stats
- This release note covers 205 changes
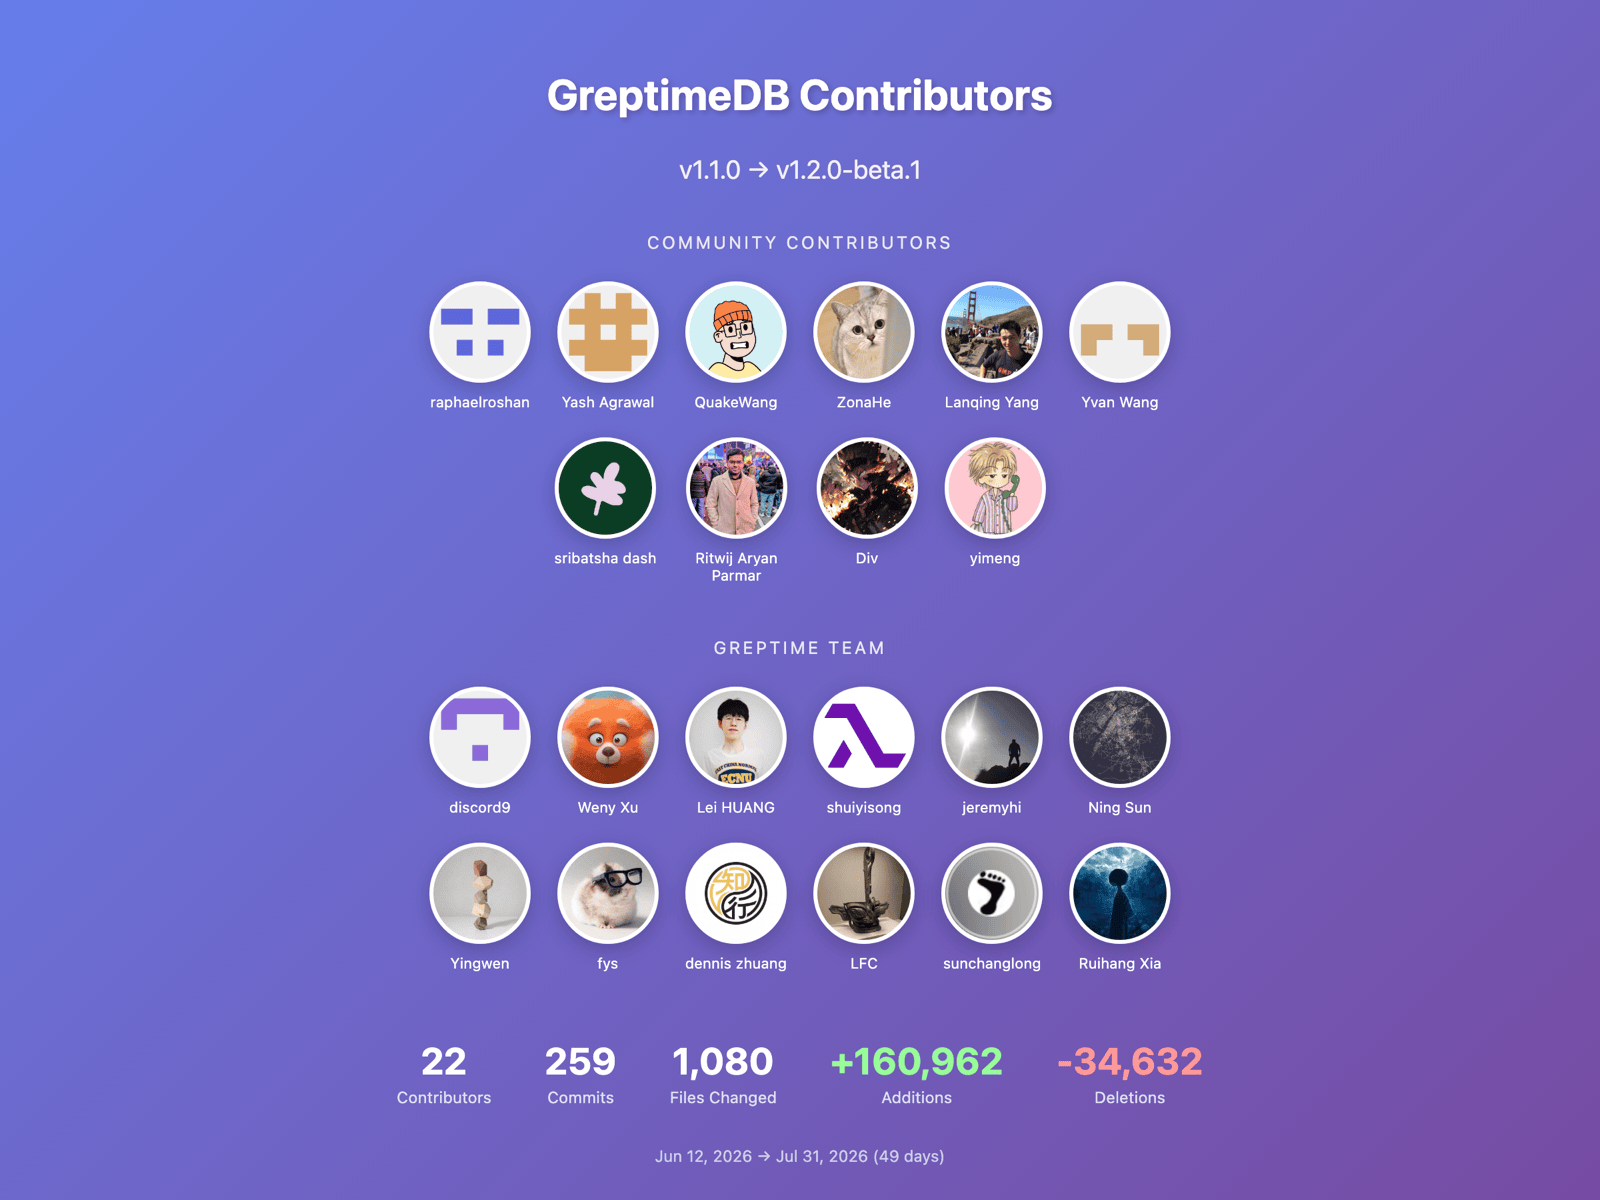
- From v1.1.0 to v1.2.0-beta.1, 22 contributors landed 259 commits
- 6 of them contributed to GreptimeDB for the first time: @agrawalx, @raphaelroshan, @srivtx, @yimeng, @divyansh-1009, @RitwijParmar
Main changes
Prometheus Remote Write v2 and native histograms
GreptimeDB now supports the Prometheus Remote Write v2 protocol. Native histograms can be persisted with write validation, and PromQL gained the corresponding native histogram functions. protobuf_message on the Prometheus side defaults to the v1 prometheus.WriteRequest, so pointing the URL at GreptimeDB alone still sends v1. Set the v2 message format explicitly:
yaml
remote_write:
  - url: http://greptimedb:4000/v1/prometheus/write
    protobuf_message: io.prometheus.write.v2.Request
With that in place, v2 sample ingestion works. Native histogram ingestion is still experimental on the GreptimeDB side and is off by default; enable it in the frontend configuration:
toml
[http]
experimental_enable_prometheus_native_histogram = true
JSON2 debuts
JSON2 is a new data type in this release. It stores JSON in a structured, column-oriented layout rather than serializing each document into a JSON string or a JSONB value. With this layout, querying nested JSON is as fast as querying a regular column, and the syntax is simpler: instead of UDFs like json_get_int, you reach a field with ..
sql
CREATE TABLE json2_table (
    ts TIMESTAMP TIME INDEX,
    my_json JSON2
) WITH ('append_mode' = 'true');

SELECT my_json.field_a.field_b::INT64 FROM json2_table;
This release also settles JSON2's read behavior on nested paths: a field still resolves when it is a scalar in one row and an object in another.
Two constraints apply on the write path. A JSON2 column requires append_mode='true' at table creation, and both CREATE TABLE and ALTER TABLE validate it. JSON values whose top level is not an object (arrays, strings, numbers, booleans, null) are rejected.
v1.2.0-beta.1 is a beta, and JSON2 goes GA in the v1.2.0 stable release. For now it is a good fit for testing environments, and we welcome your feedback. We will publish a separate post covering JSON2 in detail.
Performance
In-memory primary key columns now use a dictionary array, which reduces the cost of expanding series keys. On a test set of 200+ queries this gives roughly a 24% end-to-end improvement. Regex filtering on dictionary-encoded columns had its semantics corrected and its fast path restored at the same time.
sql
SELECT * FROM metrics WHERE job = 'node' AND path ~ '/api/.*';
-- Regex filtering on dictionary-encoded columns is now correct and takes the fast path
Range queries now prune unused input columns before the RangeSelect plan, cutting both scanned columns and I/O.
The parquet metadata cache got leaner too: it drops column metadata it never uses and adds a compression layer. Where the metadata cache previously needed a 1 GB limit, 64 MB is now enough, with no cache churn. These numbers come from the test scenarios in the corresponding PRs and do not represent every workload.
Three more optimizations ship without numbers attached: the OTLP trace ingest hot path was optimized and the default otlp.trace_ingest_chunk_size raised from 128 to 512; Prometheus remote read result conversion borrows dictionary-encoded label strings instead of copying them per row; and the compaction picker runs asynchronously rather than blocking the region worker loop.
Splunk HEC ingestion
GreptimeDB now exposes endpoints compatible with the Splunk HTTP Event Collector. An existing Splunk collection pipeline (Vector's splunk_hec sink, the OTel Collector's splunk_hec exporter, Fluent Bit) only needs a new URL and token to write logs into GreptimeDB:
text
POST /v1/splunk/services/collector/event   # JSON events
POST /v1/splunk/services/collector/raw     # Plain text, one event per line
GET  /v1/splunk/services/collector/health  # Health probe
Field mapping works like this: time maps to the timestamp, host/source/sourcetype and the keys under fields map to tag columns, event and the remaining keys become data, and index determines the table name. Requests go through the greptime_identity pipeline by default, which flattens nested event objects; override it with the pipeline_name query parameter or the x-greptime-pipeline-name header. The raw endpoint stores each line verbatim in a message column and takes metadata from query parameters. Request bodies may be gzipped.
Cluster DDL and operational events in a system table
The event recorder records more this time around. Alongside the existing region migration events, DDL on databases, tables, flows and views, plus repartition, WAL prune and bulk GC, are written to a system table as events. Answering "when was this table created, altered or dropped" no longer means digging through logs. Both the scope and the retention period are configurable:
toml
[event_recorder]
ttl = "90d"                                   # TTL of the events table, 90 days by default
event_types = ["create_table", "drop_table"]  # Omit to record everything, [] to turn it off
Permission and file access hardening
This release tightens permissions and file access in several places, one of which is a breaking change:
- SQL access to local files is sandboxed; see the compatibility notes at the end
- Query and write protocols enforce table-level permissions across the board, gaps in database ACL checks are closed, and restricted HTTP endpoints are covered by permission checks
- Invalid password assignments now fail closed instead of passing silently
- PostgreSQL supports SCRAM-SHA-256 authentication, and the static user file accepts a new
pg_scram_sha256password format - Whoever creates a database automatically gets access to it
There is a related deployment option. The main HTTP port (4000 by default) also serves operational endpoints such as /metrics, /status and /debug/prof/*, so you can now start a second port that allows only /v1 and /dashboard and returns 404 for everything else:
toml
[http]
enable_api_server = true
api_server_addr = "127.0.0.1:4006"
That way 4006 faces outward and 4000 stays on the internal network. It is off by default, and both ports share the rest of the [http] configuration.
Export/Import V2: parallelism and resumption
Snapshot-based Export/Import V2 adds concurrent chunk export (--chunk-parallelism), parallel import tasks (--task-parallelism) and progress output (--progress). It also resumes: rerunning the same command skips chunks and tasks that already finished, so you don't start over.
bash
greptime cli data export-v2 create \
  --addr 127.0.0.1:4000 \
  --to file:///tmp/greptime-snapshots/demo \
  --chunk-parallelism 4
# Rerun the same command to continue from existing progress
For full usage, see the Export/Import V2 documentation.
Other improvements
Streaming EXPLAIN ANALYZE:
POST /v1/sql/analyze/streamreports per-stage metrics as the query runs, so you don't wait for the whole distributed query to finish.http.experimental_enable_explain_analyze_streamis on by defaultManual compaction accepts a time range.
start_timeandend_timemust appear together, the interval is half-open[start_time, end_time), and timestamps without a time zone are interpreted in the session time zone:sqlADMIN COMPACT_TABLE('t', 'regular', 'parallelism=2,start_time=2026-01-01T00:00:00Z,end_time=2026-02-01T00:00:00Z');auto_flush_intervalis now a table-level option, set at creation or changed withALTER TABLE SET, instead of one global cadence for every regionA MySQL object store backend is new. It does not support repartition yet: OpenDAL's MySQL service has no native
copy, so the region file copy that repartition triggers returnsUnsupportedDashboard updated to v0.13.10, most notably self-contained dashboard snapshots that open read-only without querying the live data source
Notable fixes
Three fixes worth checking against your own workload:
- PromQL had three classes of bugs that produced wrong or missing results: plain NaN samples were dropped,
ormatching mishandled missing labels and empty operands, and query-aligned range tails were truncated - The MySQL protocol returns an error for timestamps it cannot represent instead of returning wrong data
- In the metric engine, logical projection indexes are validated, route pruning uses the physical partition type, and a missing route column no longer panics
Compatibility notes
SQL local file access is sandboxed (#8708)
When COPY FROM/TO, COPY DATABASE and file engine external tables touch local files, paths are now confined to a sandbox directory, <storage.data_home>/copy by default: relative paths resolve inside the sandbox, and absolute paths are accepted only if they fall inside it. The new storage.copy_root setting points the sandbox at a dedicated local directory; values that would expose GreptimeDB's internal data, WAL, manifest or configuration directories are rejected. In distributed deployments, SQL access to Datanode local files is disabled. Object storage paths (S3/OSS/GCS/AzBlob) are unaffected.
Before upgrading: review COPY workflows and external tables that reference local paths outside the sandbox, then move the files into the sandbox, set storage.copy_root, or switch to object storage.
holt_winters removed, fill modifiers rejected (#8457)
promql-parser is upgraded to v0.10.0 and the deprecated holt_winters compatibility shim is gone. The fill, fill_left and fill_right modifiers are rejected outright until the outer-join semantics they require are implemented, which avoids producing silently wrong query plans.
Before upgrading: check whether your PromQL queries and alerting rules still use holt_winters or these fill modifiers.
sparse_primary_key_encoding setting removed (#8470)
The metric engine always uses sparse encoding now, and the sparse_primary_key_encoding setting is retired. Leaving it in an existing configuration file does not raise an error, so you can clean it up whenever it is convenient.
Pipeline integer narrowing checks (#8589)
When a pipeline transform converts an integer to a narrower declared type, it now range-checks first. Out-of-range values no longer wrap silently (previously -1 to uint8 gave 255 and 256 to int8 gave 0); instead they follow the configured on_failure policy: ignore, default, or a hard error. Narrow numeric strings follow the same range rules.
Before upgrading: if a pipeline relied on wrapping, adjust the input data or the on_failure setting.
Closing
This release is worth testing if any of these apply: you write through the Prometheus ecosystem and care about native histograms; you ingest JSON logs at volume; you have high series cardinality and are sensitive to query performance; or you need cross-instance migration and regular backups.
It is a beta, so validate it in a test environment first, and go through the 4 breaking changes above one by one before upgrading. The full change list is in the GitHub Release.
Thanks to the 22 contributors in this cycle. Six of them contributed for the first time:
- @agrawalx built the Splunk HEC ingestion
- @raphaelroshan added table-level
auto_flush_interval, along with connection string redaction and a literal negation panic fix - @srivtx added
ALTER TABLE SET auto_flush_interval - @yimeng made PostgreSQL accept
intervalstylewithout quotes - @divyansh-1009 made timestamp display precision follow the column schema
- @RitwijParmar made Prometheus label discovery stream catalog tables instead of looking each one up by name
These capabilities will keep improving before the v1.2.0 stable release, and we welcome bug reports from your testing.


