
On this page

Putting metrics, logs, and traces into one columnar store, querying them together, and holding up under production load: that has been done, by more than one vendor. And in 2026, all of them connected agents. The real question sits one layer further down. Once agents become first-class consumers, does the database itself have to change, and how far?
"Unified observability" has been a talking point for close to eight years, and the common impression was that it remained an idea rather than a product. That impression is out of date. Systems that put all three signals into one columnar store, query them together, and run at production scale exist today.
By 2026, those systems have also connected agents. So the interesting question is not whether anyone noticed agents; everyone did. It is what happens next. When agents become first-class consumers alongside humans, does the change stop at the interface, or does it reach the database underneath?
Unified storage is no longer a proposal
SigNoz stores metrics, logs, and traces in a single ClickHouse instance, OTel-native throughout. ClickStack is the clearer case. ClickHouse acquired HyperDX in March 2025 and shipped ClickStack that May, packaging the OTel Collector, ClickHouse, and a query experience into one open-source stack where all three signals are explored together.
Honeycomb got there earlier, betting on arbitrarily wide structured events and building its own columnar store underneath. Charity Majors made an observation in 2024 that has been quoted many times since: the observability startups founded recently converged on a unified storage model, wide structured events, OTel-native, usually on a columnar database. Her framing was that nobody builds a cheaper Datadog anymore; they build a cheaper Honeycomb.
She later walked back part of that optimism. In 2025 she wrote "The pillar is a lie," arguing that signal is a technical term while pillar is a marketing one. By July 2026 the criticism had sharpened. Columnar storage has become close to standard for observability backends built after 2019, yet many of those products still ship the three-pillar model and still sell themselves as some flavor of "Datadog, but cheaper." What frustrates her is that these vendors have the better architecture and choose not to say so. Swapping the storage engine did not change the paradigm.
Even so, three signals in one columnar store is becoming a solved problem at the storage and experience layers, arguably a commoditized one. Claiming that nobody has built unified storage no longer matches reality.
So why isn't this the finish line?
Two engineering choices, and one assumption that no longer holds
These systems share three traits. Two of them are engineering choices worth arguing about. The third is an assumption.
The first is a general-purpose engine underneath. ClickHouse is among the most common foundations for this generation of unified systems, with Honeycomb's in-house columnar store as the notable exception. It is a columnar store designed for general-purpose OLAP, and it is good at that, but general analytics is where its design starts. The access patterns of the three signals are not. Metrics want aggregation and downsampling. Logs want full-text search. Traces want point lookups by ID and tree traversal.
ClickHouse has been closing that gap itself, adding a TimeSeries table engine, PromQL, and full-text search. Full-text search is GA now, though ClickHouse is explicit that it does not implement BM25-style relevance scoring and is meant to accelerate token-level filtering rather than replace a dedicated search engine. TimeSeries and PromQL are still experimental; the post introducing the PromQL work includes the line "there are dragons here."
A general-purpose columnar store can clearly do observability, and it does it well. But if every one of these signal-specific capabilities is unavoidable and eventually has to live inside the database, what should a unified engine look like if observability workloads were the design target from day one?
The second choice puts unification at a different layer. In Grafana's LGTM stack, Loki holds logs, Tempo holds traces, Mimir holds metrics, and Grafana handles visualization. What gets unified is the experience and control layer; the storage engines stay independent. That is a coherent choice with clear costs and benefits. Each signal evolves on its own schedule, and cross-signal correlation has to happen higher up.
The third shared trait is the easiest to miss: every one of these systems was designed for a person. The SigNoz explorer, the ClickStack search experience, and the Honeycomb query interface all assume an engineer sitting in front of a screen, querying linearly, thinking while staring at a dashboard, holding the correlation between three signals in their own head.
The first two are engineering trade-offs. The third runs deeper, because it is the premise the whole design rests on, and 2026 is rewriting it across the industry.
To understand this, look at how it split apart
The phrase "three pillars" rolls off the tongue so easily that it sounds like a law of nature. Nobody designed it. Metrics, logs, and traces evolved independently along different problem domains and technical paths, and were grouped into a single observability framework only later.
Metrics came first. From RRDtool (1999) to Graphite (open-sourced 2008) to Prometheus (2012), the question was always whether the system is healthy right now. Logs followed. Splunk (2003) and Elasticsearch (2010) answered a different question, what actually happened, and the answer took the shape of an inverted index. Distributed tracing came later, mostly because the problem itself only became pressing as microservices spread: Google published the Dapper paper in 2010 without releasing the code, and Zipkin, open-sourced by Twitter in June 2012, was the first usable open-source implementation.
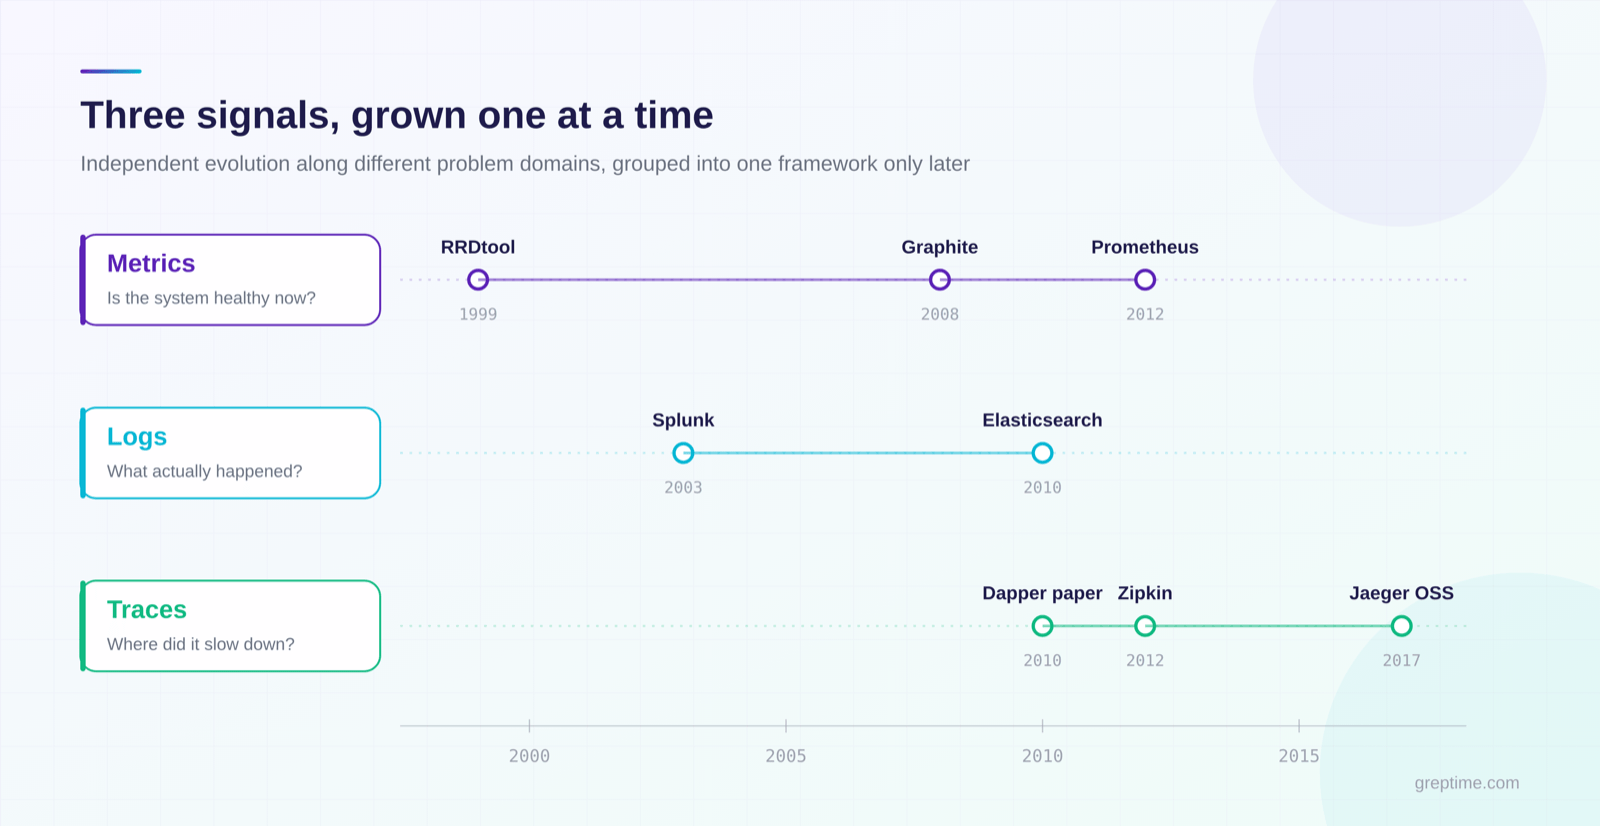
Figure 1: three signals, each grown along its own problem domain, grouped into one framework only later
These are three independent answers to three independent questions. Calling them three views of one system is a label applied in retrospect. And their engineering constraints conflict sharply:
| Dimension | Metrics | Logs | Traces |
|---|---|---|---|
| Data shape | Time-series points | Text / structured records | Span trees |
| Query pattern | Aggregation, downsampling | Full-text search, filtering | Point lookup by trace_id, causal analysis |
| Cardinality | Low (classic case) | Medium to high | High (trace_id) |
| Retention | Long (downsampled) | Short to medium | Medium |
| Common backend then | Time-series stores | Inverted indexes | Cassandra / ES |
Given the technology available in the early 2010s, building one system that did all three well was difficult. Whatever you optimized for one signal became a tax on another. Splitting them was the cheaper path and the one more likely to succeed. Calling that shortsighted is hindsight.
Business incentives then reinforced the technical split. Splunk grew out of log search, Datadog started with infrastructure monitoring, and New Relic made its name in APM. For incumbents, staying split was the moat, since unifying meant giving up the ground where their pricing power was strongest. The buyer side was fragmented too: infrastructure monitoring belonged to SRE and platform teams, APM to developers, logs often to security or data teams. The budget already sat in three different pockets.
A constraint of that era became the industry's default worldview.
The unification argument goes back eight years
One of the people who helped define the three-signal framing was also among the first to question it.
In February 2017, after attending that year's Distributed Tracing Summit, Peter Bourgon wrote "Metrics, tracing, and logging," using a Venn diagram to sort out where the three overlap. That diagram became the conceptual origin of the three-pillars framework, though what he wanted was to give a roomful of people a shared vocabulary. The more ceremonial phrase came later, and vendors used the framework to carve up their markets.
Eighteen months later, in August 2018, Bourgon wrote "Observability signals." This time he asked the question in reverse. If metrics, tracing, and logging are just three consumption patterns for the same observational data, then in principle you could build one system, an über-system in his words, that takes raw events at the front door and de-muxes them by shape.
One detail here is frequently misread and worth stating plainly. The destinations Bourgon had in mind were purpose-driven backends. He was describing a unified write path and a unified read model, not a requirement that every signal live in the same physical database. Plenty of "unified storage" arguments today claim him as a forefather, but his proposal was more restrained: shared ingestion and access, with purpose-built backends underneath.
That December, Ben Sigelman gave a talk at KubeCon North America titled "Three Pillars, Zero Answers: We Need to Rethink Observability." He co-authored the Dapper paper, co-founded OpenTracing, and had co-founded Lightstep back in 2015, so he had built these pillars and shipped a product on top of them. His criticism was concrete. Metrics are bounded by cardinality, and cost gets away from you as dimensions multiply. The logging bill is transaction rate times number of microservices times network and storage cost times retention window, and that product runs out of control. More fundamentally, all three signals are "just bits," and stacking them as three separate pillars with three separate invoices does not scale.
In May 2019, OpenCensus and OpenTracing merged into OpenTelemetry. That was the first time unification actually landed at the standards layer, with one caveat that matters. OTel unified collection and protocol, and left storage and query where they were. The upstream pipes were connected; downstream, the three pools stayed three pools. Its most underrated legacy is something else entirely: the semantic conventions. What http.request.method should be called, which standard fields belong on a span for a database call, all of it hardened into industry consensus. At the time it looked like the clerical work of aligning field names, and the payoff arrived years later, in exactly the agent scenario this piece is building toward. The GenAI semantic conventions extend that same work into the agent era; we went through them layer by layer in May.
In late 2023, Charity Majors proposed Observability 2.0: one source of truth, arbitrarily wide structured events, with metrics and traces as derived views. That is the same line of thinking as Bourgon's five years earlier, raw events as primary and the three pillars as secondary.
The paradigm has its critics. The most common objection is cost. Wide events preserve high cardinality and high dimensionality in full, so the data volume per request exceeds any single pillar, and metrics remain considerably cheaper for large-scale aggregation workloads, which makes them hard to displace in the near term. Even the "2.0" label is contested, and Majors has said she is not particularly fond of the framing.
By summer 2026, everyone had seen agents coming
If this article stopped here, the obvious next sentence would be that all of these systems were built for humans and nobody has thought about agents yet.
That sentence would be wrong.
In 2026 this became a collective industry move. SigNoz announced agent-native observability in May, shipping a hosted and an open-source MCP server, an in-product AI teammate, and a set of Agent Skills that teach coding agents how to work with SigNoz. ClickHouse launched the ClickStack MCP server and AI Notebooks at Open House in late May, and its site now describes ClickStack as "observability built for agents," explicitly positioning it against dashboard-first, human-centric workflows. Grafana pushed six AI capabilities to GA during its AI Week in late July, among them Assistant Investigations, which forms hypotheses on its own and investigates across metrics, logs, traces, and profiles in parallel before producing a report. Honeycomb now describes its platform as serving developers and AI agents alike.
So the claim that nobody has noticed agents does not hold. Everyone noticed, and they moved quickly. All of this is about agents as consumers of observability data; agents as the thing being observed is a separate problem, and one we looked at earlier.
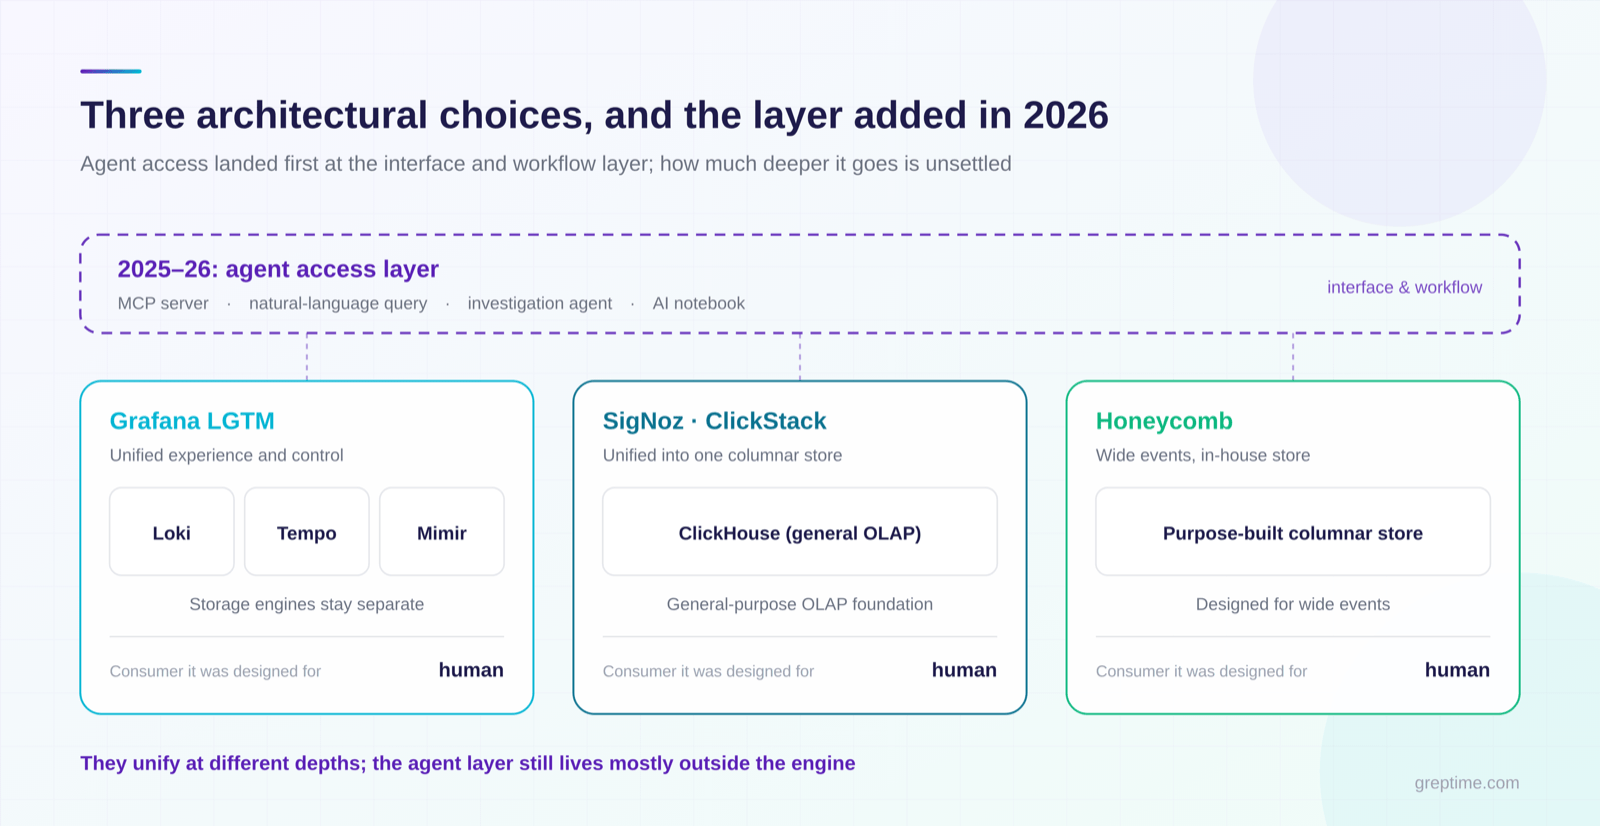
Figure 2: three architectures that unify at different depths, and the agent access layer all of them added in 2026
One detail deserves attention. In writing about the ClickStack MCP server, ClickHouse noted that a general-purpose ClickHouse MCP server already existed and worked fine for SQL exploration. While building AI Notebooks, though, they found that observability investigation behaves differently from general BI: models perform noticeably better against structured investigative primitives than against raw SQL. So they wrapped log pattern analysis, trace outlier investigation, and cross-signal correlation into semantic tools for agents, and published internal evaluations showing that the specialized tools reduced tool calls and improved consistency compared to the generic MCP server.
That result points at something deeper. An agent needs more than a connection to the data. It needs to know what the data is, how the pieces correspond, and how to ask.
How far down does the change go?
MCP, natural-language querying, automated investigation, and Agent Skills are the obvious first layer. But the changes are already reaching below the interface. When ClickHouse discusses agent scenarios, the subject is no longer only the interface: high-concurrency query capacity, unsampled full-fidelity telemetry, longer retention, dedicated compute that isolates agent load from ingest and user-facing traffic. None of those are interface concerns. They point at the engine and at the cost model.
Several things remain unsettled.
Agents consume data in parallel and exploratively. A single investigation can fan out into dozens or hundreds of queries, most of them abandoned halfway. Is that purely a concurrency load for the execution layer to absorb, or does it eventually reshape data layout and query planning?
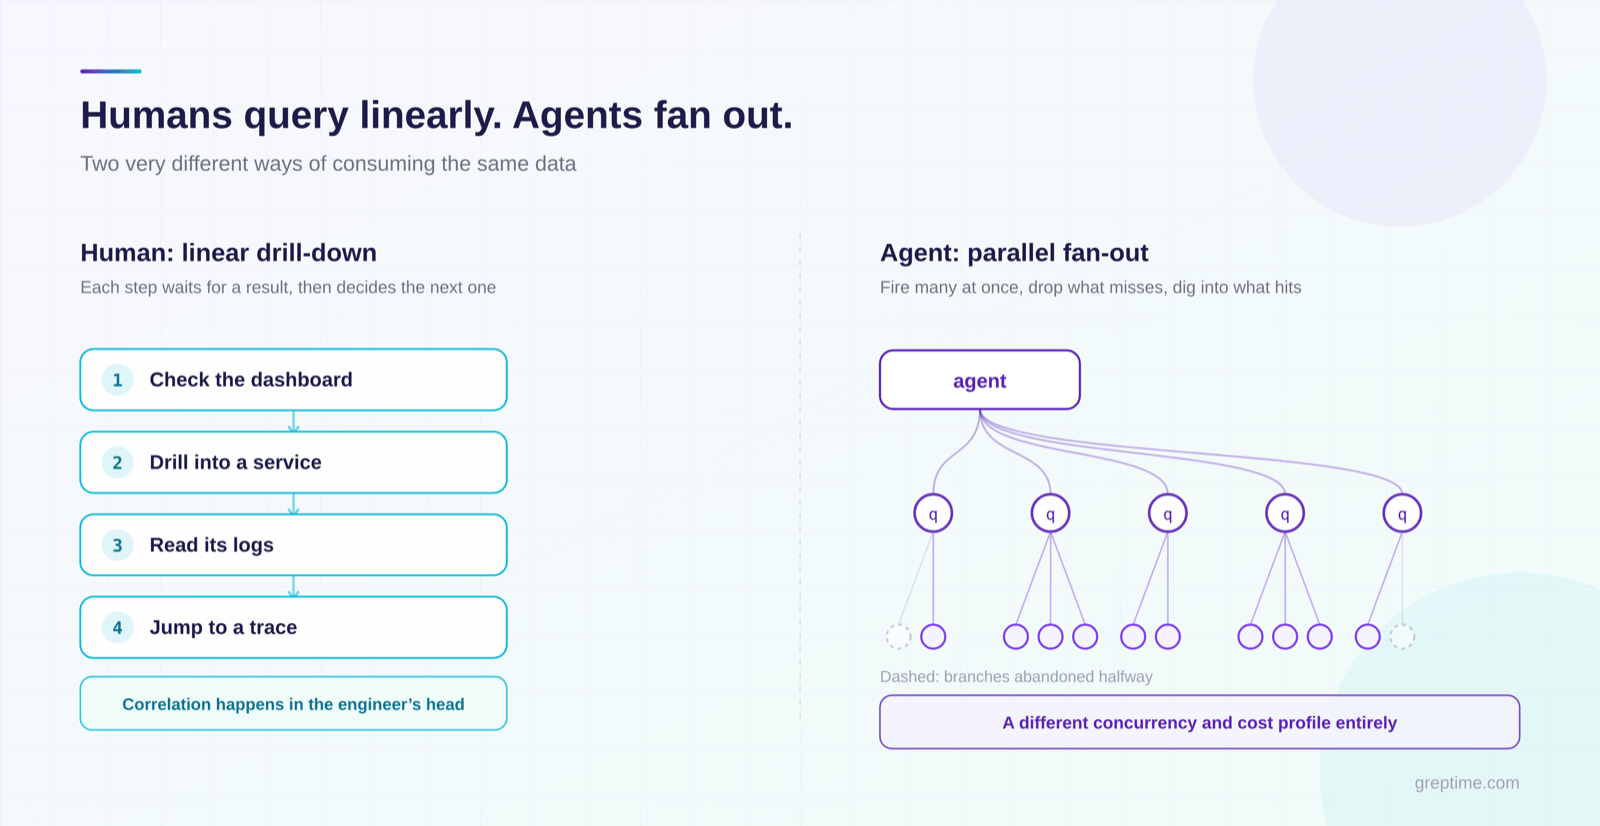
Figure 3: a human drills down one step at a time; an agent fans out and throws most of the branches away
Where should observability semantics live? In the implementations visible today, semantics sit in the MCP server, the notebook, or a product API, and are ultimately translated into queries optimized for the engine underneath. Should they stay in that tool layer, or should part of them sink into the data system as first-class metadata it can declare on its own? OTel turned semantic conventions into an industry standard; which layer should actually make use of that semantic information is still open.
And a plainer question: when an agent connects for the first time, how does it find out what data is here? A human opens the UI and browses. An agent needs an entry point it can read programmatically.
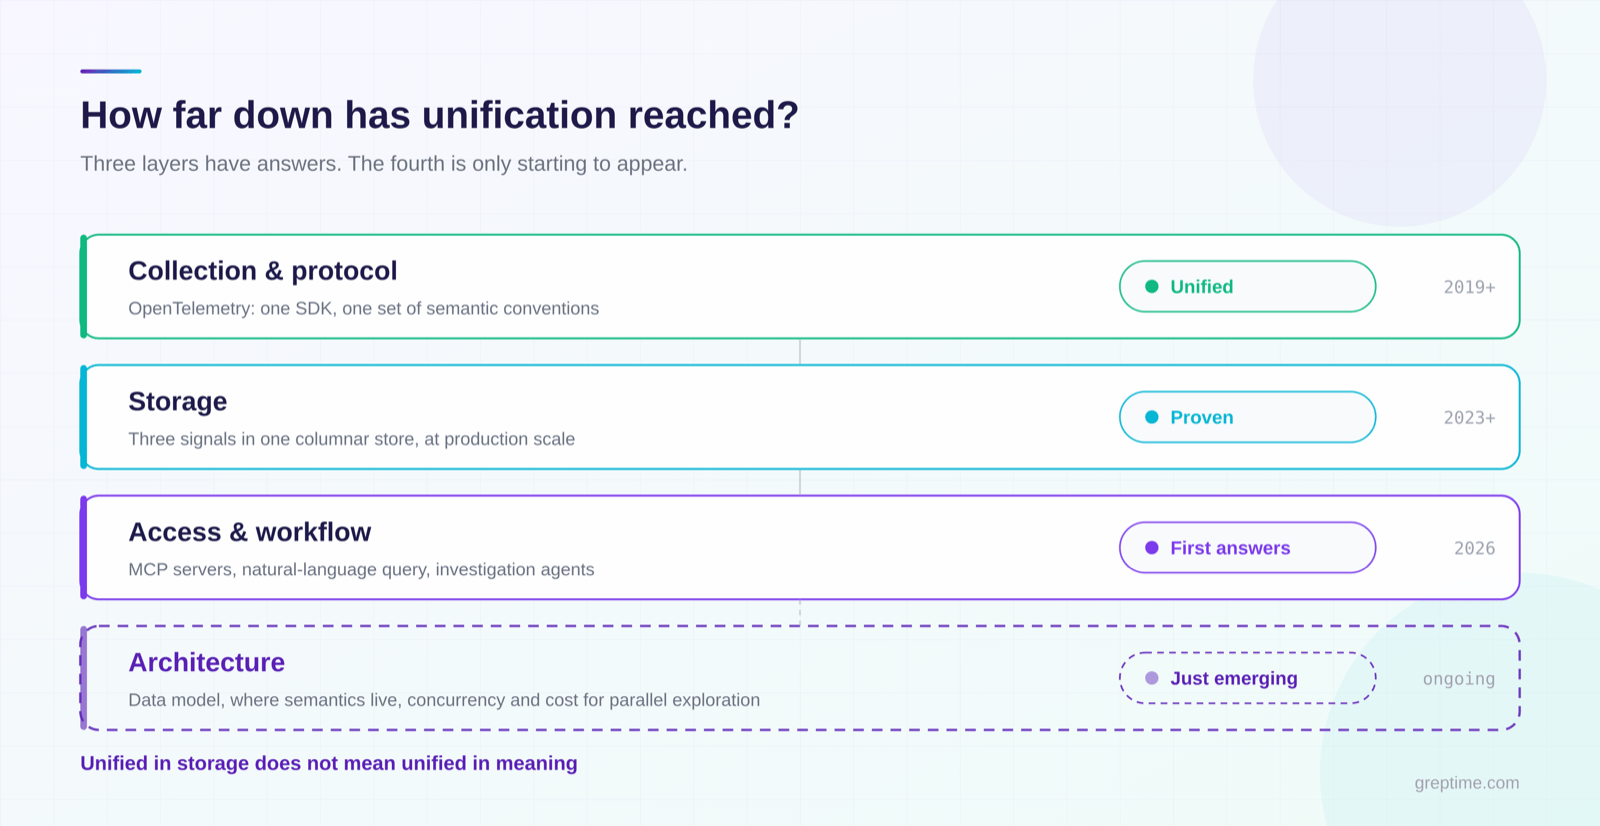
Figure 4: collection, storage, and access have answers; the architecture layer is only starting to appear
Unified storage solved the data fragmentation inherited from the human era of observability. Agents raise the next problem: whether data that has been unified in storage is also unified in meaning, and whether a machine can understand, explore, and consume it efficiently.
The industry has produced its first answers at the interface layer. Answers at the architecture layer are only starting to appear, and they are nowhere near converged. What an observability database should and should not do in the face of this problem is where we will pick up in a later post.


