
On this page

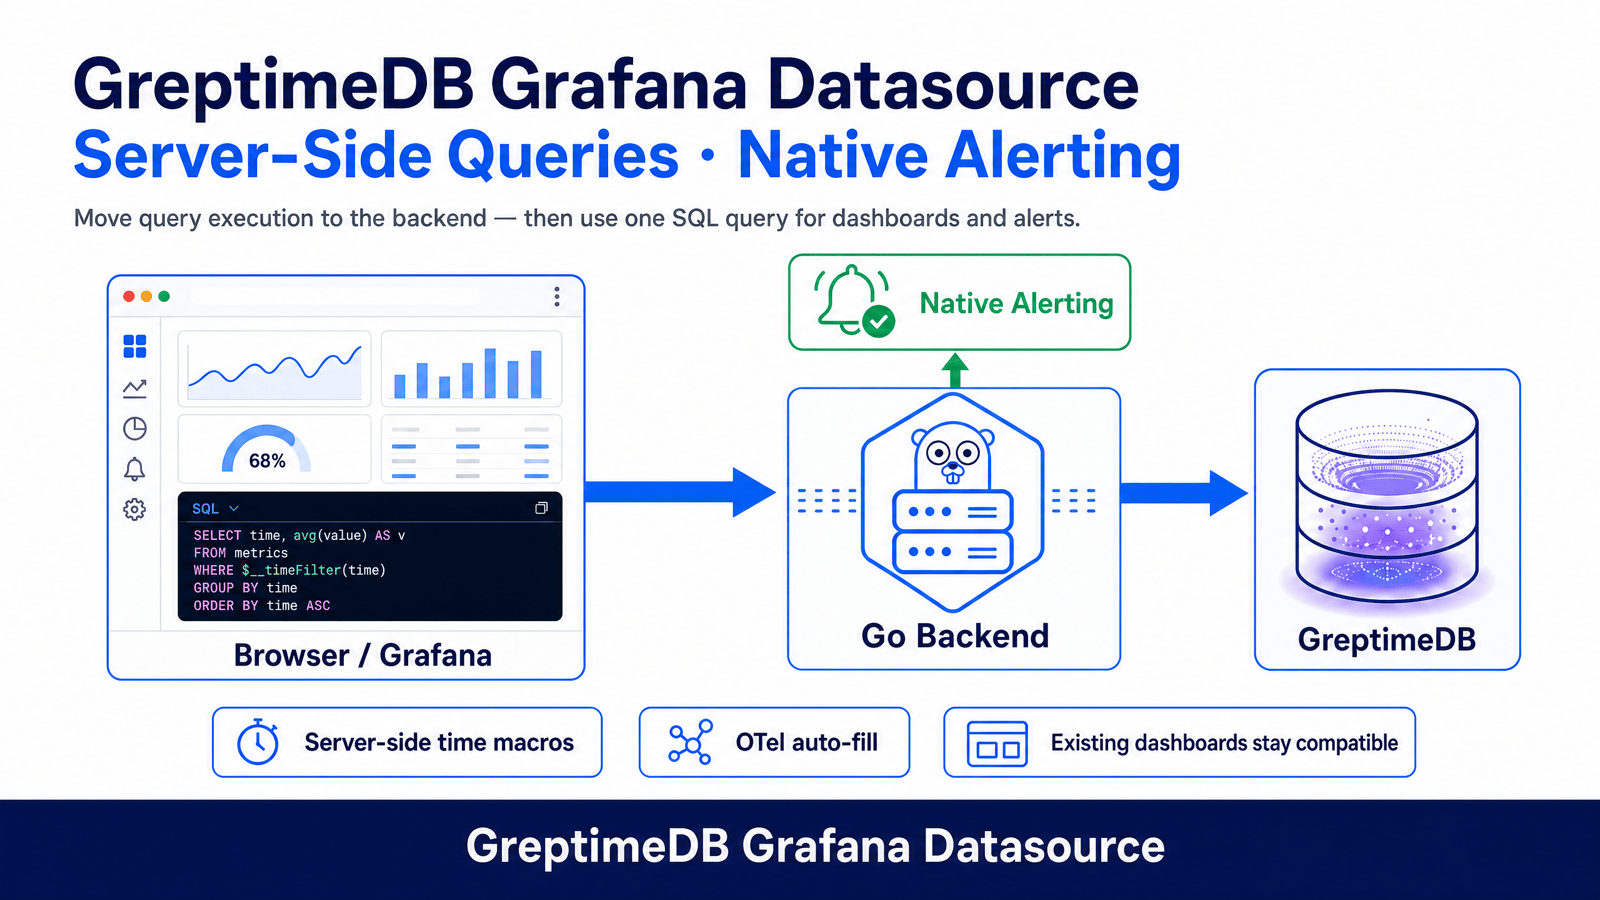
This release adds a Go backend to the plugin. Queries no longer go from the browser straight to GreptimeDB; the backend now proxies them to the /v1/sql endpoint. Alerting is what prompted the change. Grafana evaluates alert rules on the server, where it has no access to the frontend's interpolation logic, so panel SQL that ran fine on a dashboard could never be used in an alert. With the backend in place, native Grafana alerting works, time macros are parsed and expanded on the server, and the data structures on both sides are now consistent. This release also adds an auto-fill toggle for OpenTelemetry (OTel) data, which simplifies field configuration for Logs and Traces.
Backward compatibility:
The new version remains backward compatible with the existing architecture. Your SQL panels, Query Builder configurations, and the Table, Time Series, Logs, and Traces query views all continue to work, and existing dashboards are unaffected.
Core improvements
1. Native Grafana alerting
Because queries were computed in the frontend, panel SQL could not trigger alerts. After the upgrade:
- Before: panel SQL could not be used to create Grafana alerts.
- After: the same panel SQL, time macros included, can be used directly in a Grafana alert rule.
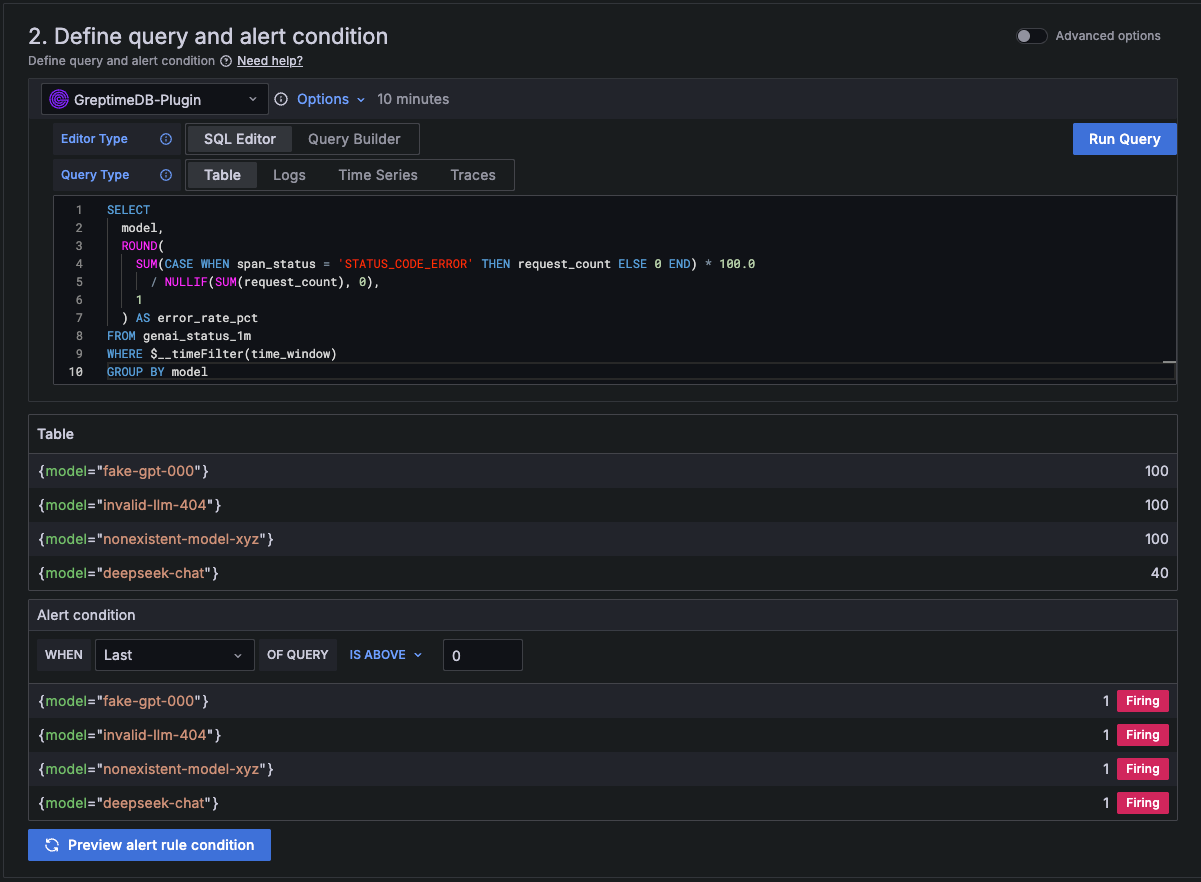
Panel SQL with $__timeFilter, used directly as an alert rule condition.
Note that alert queries should express their time range with time macros rather than hard-coded start and end times. Otherwise every evaluation re-queries the same slice of history.
2. Time macros expand server-side
Macros such as $__timeFilter used to be interpolated in the browser. Parsing and expansion now happen entirely on the server, which is what lets time macros work during alert rule evaluation.
In the expansions below, <from>, <to>, and <interval> are placeholders, replaced at expansion time with the panel's current time range and auto interval.
New and most commonly used:
$__timeFilter(col): expands tocol >= <from> AND col <= <to>, limiting the query to the dashboard's selected time range.
sql
SELECT timestamp AS timestamp, body, level, trace_id
FROM genai_conversations
WHERE $__timeFilter(timestamp)
ORDER BY timestamp DESC
LIMIT 100;$__timeInterval(col): expands todate_bin(<interval>, col), with bucket width following the panel's auto interval.
sql
SELECT $__timeInterval(timestamp) AS time,
       SUM(`span_attributes.gen_ai.usage.input_tokens`) AS input_tokens
FROM opentelemetry_traces
WHERE $__timeFilter(timestamp)
GROUP BY time ORDER BY time;
Also new:
$__timeFilter_ms,$__fromTime_ms,$__toTime_ms,$__dateFilter,$__dateTimeFilter, and$__interval_s.
Existing macros (still supported, now expanded server-side):
$__fromTime/$__toTime: start and end time literals, useful for hand-written complex conditions.$__interval: the panel's auto interval value (1 minute, for example), used to control bucket width.
During expansion, reserved words such as timestamp are automatically double-quoted, so column names do not collide with SQL keywords.
Query and configuration improvements
1. New Use OTel auto-fill toggle
For querying OpenTelemetry data, the plugin adds a Use OTel option and a version selector to the data source settings and to the Logs/Traces Builder:
- Enabled: fields are filled automatically with GreptimeDB's standard OTel-style column names, such as
trace_id,span_name, andduration_nano. - Disabled: if you use a custom schema, configure the fields manually as needed.
2. Ad-hoc filter injection
- Query Builder: ad-hoc variables are injected as standard
WHEREconditions, with support fortable.columnqualification across tables. Filters whose target table does not match the current panel are ignored. - SQL Editor: nothing is injected, so hand-written SQL is never rewritten.
3. Preconfigured demo dashboards
The data source's Dashboards tab now ships dashboards you can import in one click:
- GreptimeDB - OTel Min Demo
- GenAI Observability
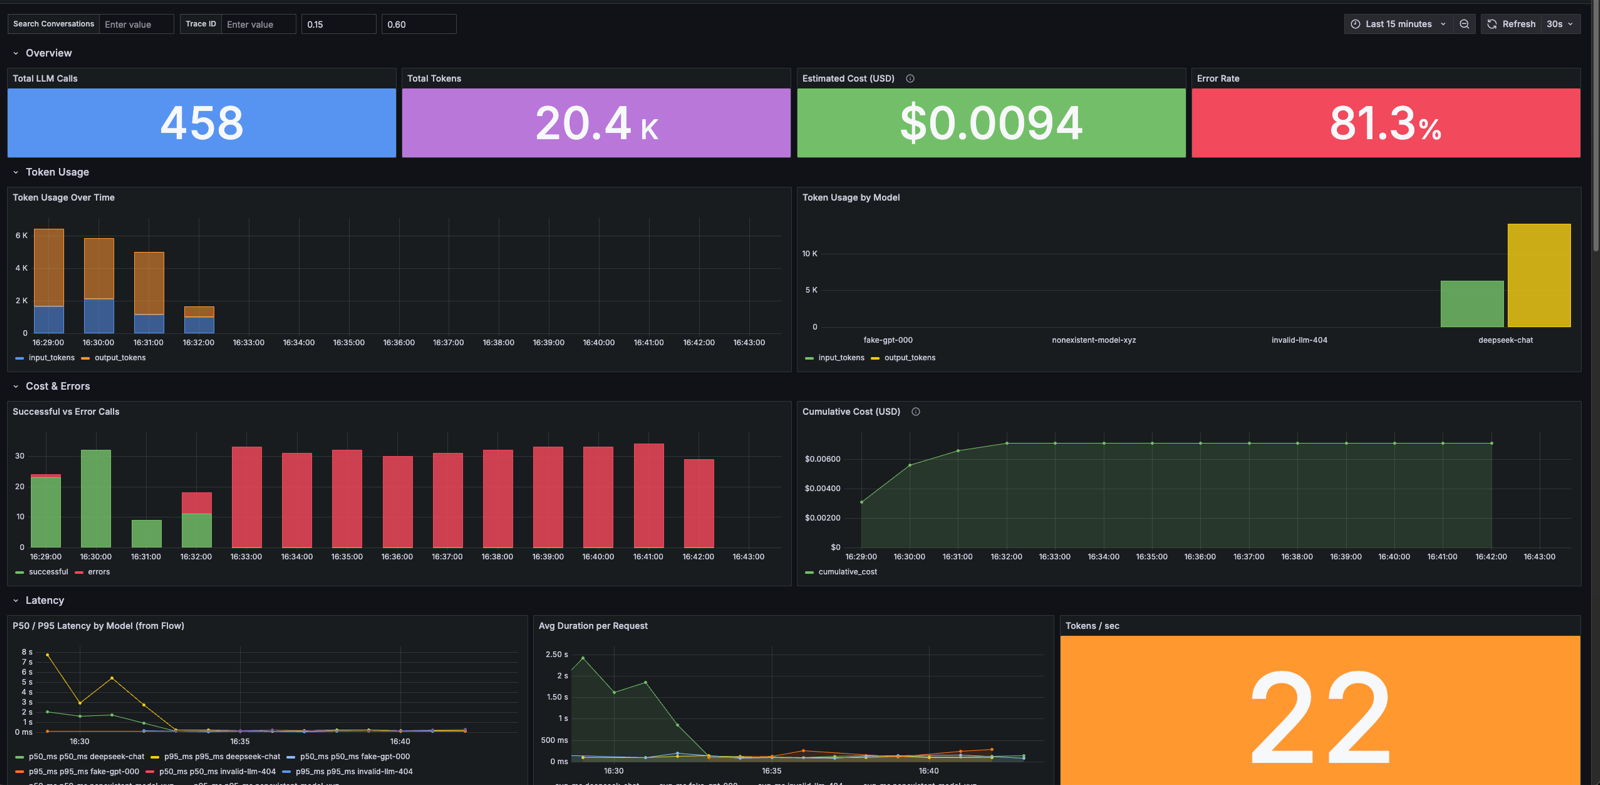
The GenAI Observability dashboard, populated with data from the demo-scene sample project.
Tip: Imported dashboards contain no data by default. To see the full charts, use the official demo-scene/genai-observability sample project to write simulated data into GreptimeDB.
Installation and configuration
The latest plugin version is v3.0.3. For installation steps, extraction and configuration details, and Docker image usage, see the Installation section of the GitHub README.
Note that the plugin now includes a backend process. When upgrading from an older version, restart Grafana after replacing the plugin directory. Existing dashboards need no changes.


