
On this page

In August 2024 we used TSBS to compare the read and write performance of GreptimeDB and InfluxDB (original post). InfluxDB 3.x had no stable release at the time, so we tested InfluxDB v2 and said we would rerun the benchmark once InfluxDB 3 was ready.
This round compares GreptimeDB v1.2.0 with InfluxDB 3.11.1, covering both the open-source Core edition and the commercial Enterprise edition. In 3.11 the two editions use different storage formats. Core still uses Apache Parquet. New Enterprise clusters default to a new columnar file format (.pt files), while clusters created on 3.10 or earlier keep Parquet until the storage engine upgrade is run (see the InfluxDB 3 Enterprise storage engine docs). GreptimeDB stores its SST files in Apache Parquet.
That gives this benchmark two comparisons: GreptimeDB against InfluxDB 3 Core, both on Parquet, and GreptimeDB against InfluxDB 3 Enterprise, which has moved to a proprietary format.
Results at a glance
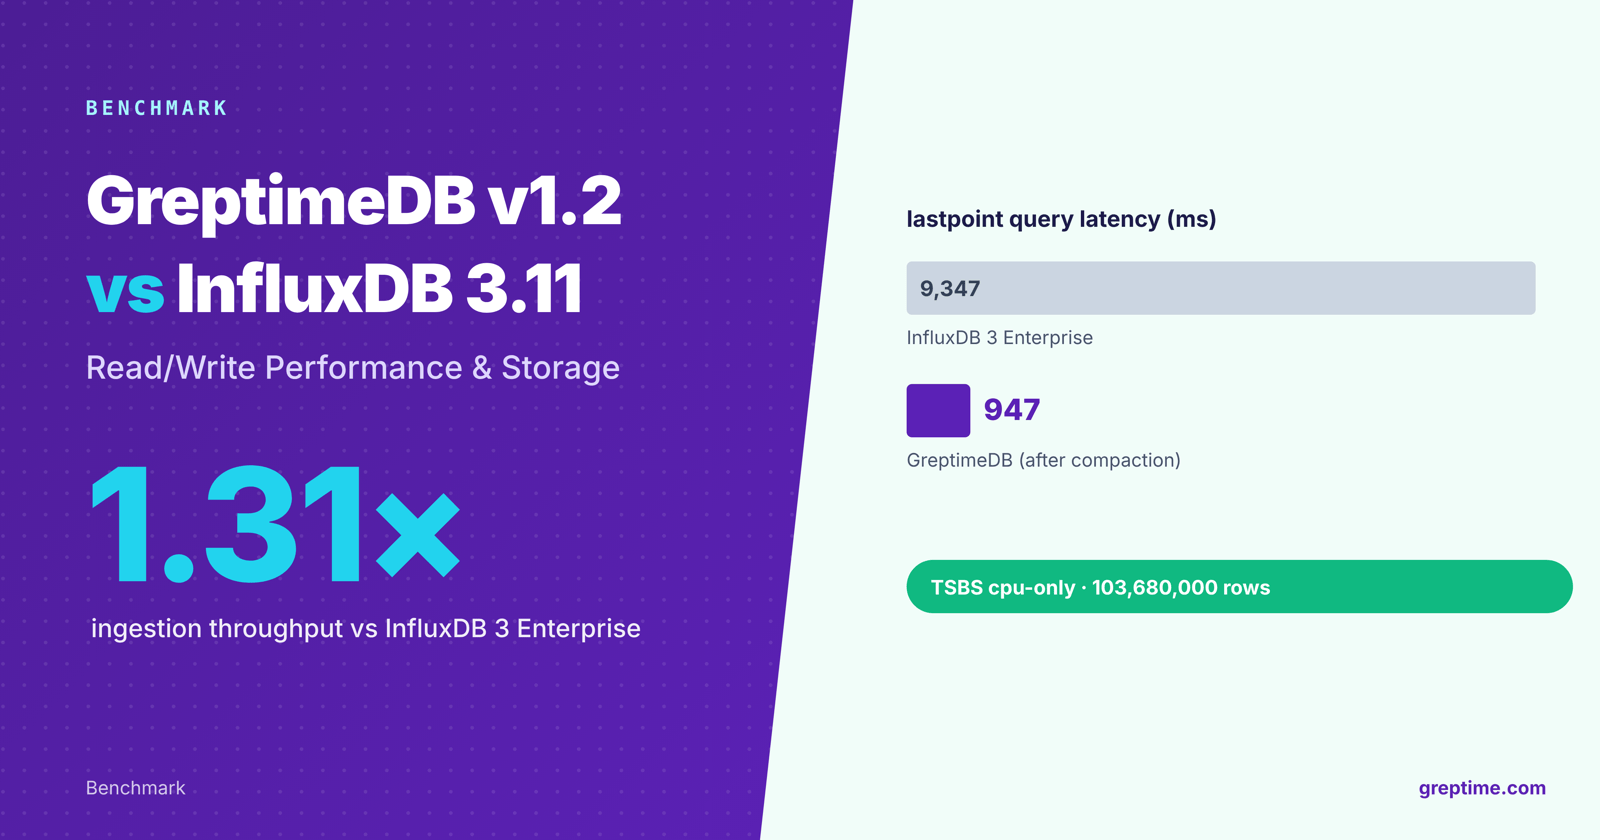
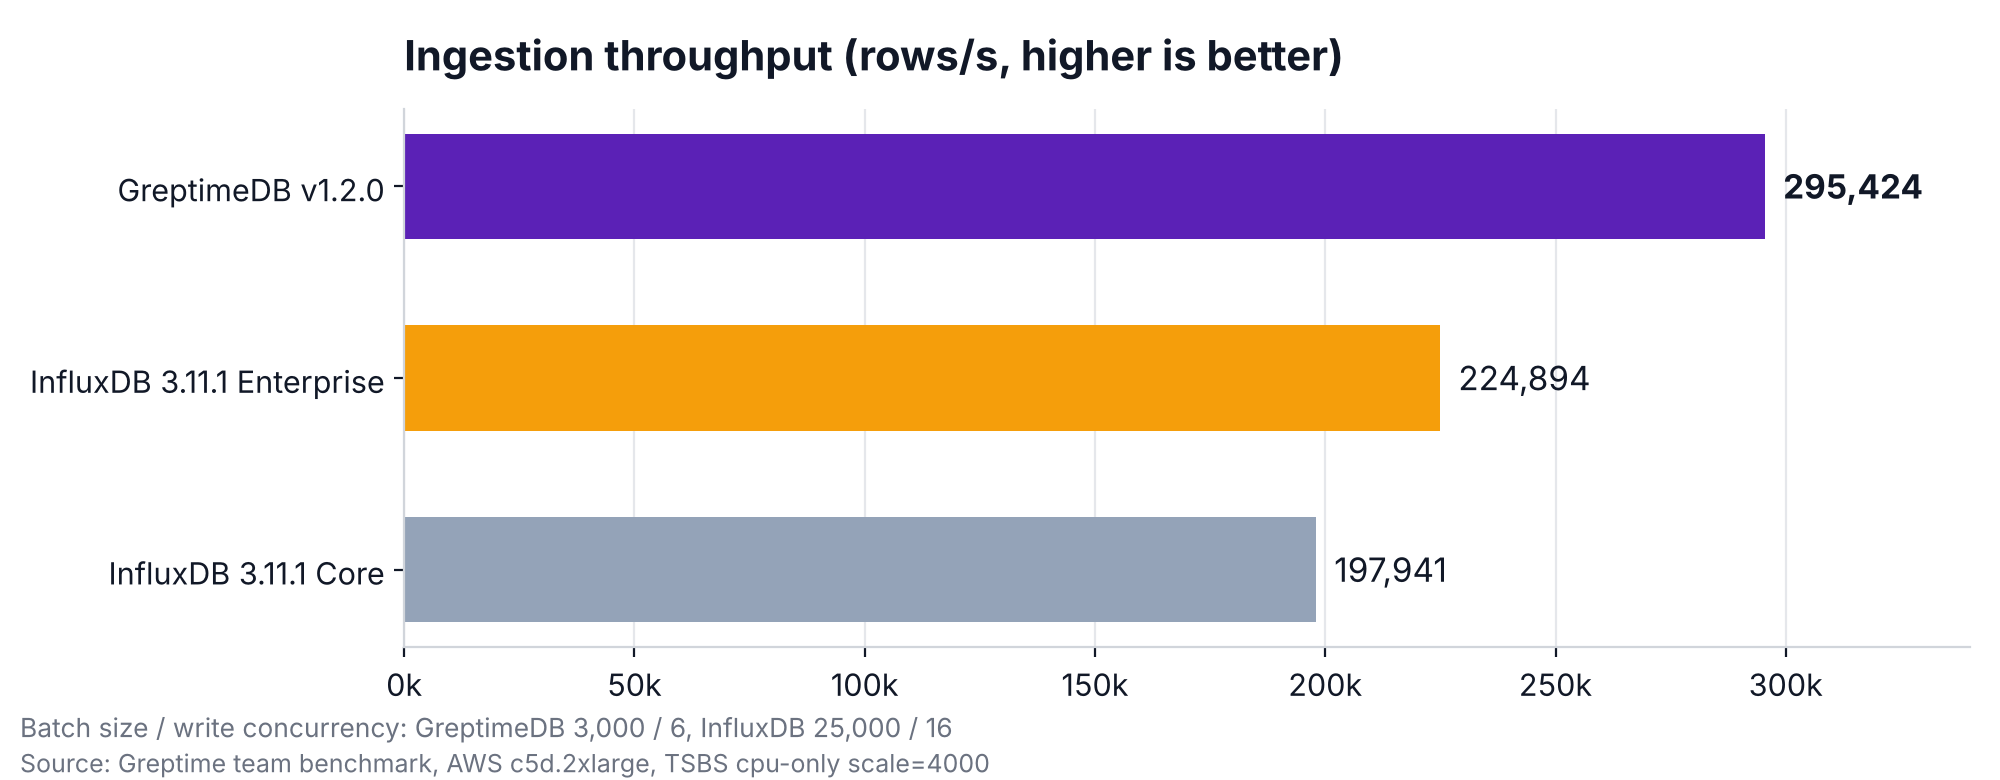
- GreptimeDB ingested 295,424 rows/s, 1.31x InfluxDB 3 Enterprise and 1.49x InfluxDB 3 Core. InfluxDB ran with a larger batch size and higher write concurrency.
- On queries, GreptimeDB and Enterprise each win a share. On the 9 query types that touch only 1 or 8 hosts, Enterprise is faster, and both finish within tens of milliseconds. On group-by aggregations, ordering, and lastpoint queries across all hosts, GreptimeDB is faster; after one manual compaction, GreptimeDB's lastpoint latency is about 1/10 of Enterprise's.
- InfluxDB 3 Core, which also uses Parquet, is slower than GreptimeDB on 13 query types and ran out of memory (OOM) on the other 2, groupby-orderby-limit and lastpoint.
- Disk usage after ingestion: Enterprise used 1.3 GB in total; GreptimeDB had about 850 MB of SST files plus 1.5 GB of WAL; Core's usage was mainly 12 GB of WAL.
Test environment
| Item | Details |
|---|---|
| Instance | AWS c5d.2xlarge (8 vCPU, 16 GB memory) |
| OS | Ubuntu 24.04 LTS |
| Storage | 300 GB gp3 |
| Software | TSBS (GreptimeTeam/tsbs) InfluxDB v3.11.1 Core InfluxDB v3.11.1 Enterprise GreptimeDB v1.2.0 |
| Dataset | cpu-only, scale=4000 Time range 2023-06-11 to 2023-06-14 Sampling interval 10s |
All three databases used local file storage, and only one database ran at a time.
Data and queries
The data comes from the TSBS cpu-only use case: a single cpu table with 10 tags and 10 fields. scale=4000 simulates 4,000 hosts, each reporting every 10 seconds for 3 days, for 103,680,000 rows and 1,036,800,000 metrics in total. The dataset was generated once in influx format without compression, and all three databases loaded the same data.
The queries are the full TSBS query set, 15 types:
| Query | Description |
|---|---|
| single-groupby-1-1-1 | MAX of 1 metric for 1 host, every 5 minutes over 1 hour |
| single-groupby-1-1-12 | MAX of 1 metric for 1 host, every 5 minutes over 12 hours |
| single-groupby-1-8-1 | MAX of 1 metric for 8 hosts, every 5 minutes over 1 hour |
| single-groupby-5-1-1 | MAX of 5 metrics for 1 host, every 5 minutes over 1 hour |
| single-groupby-5-1-12 | MAX of 5 metrics for 1 host, every 5 minutes over 12 hours |
| single-groupby-5-8-1 | MAX of 5 metrics for 8 hosts, every 5 minutes over 1 hour |
| cpu-max-all-1 | Hourly aggregate of all CPU metrics for 1 host |
| cpu-max-all-8 | Hourly aggregate of all CPU metrics for 8 hosts |
| double-groupby-1 | Average of 1 CPU metric per host per hour across all hosts, over 24 hours |
| double-groupby-5 | Same, with 5 CPU metrics |
| double-groupby-all | Same, with all 10 CPU metrics |
| high-cpu-1 | Readings where a metric exceeds a threshold, for 1 host |
| high-cpu-all | Readings where a metric exceeds a threshold, across all hosts |
| lastpoint | The latest reading for each host |
| groupby-orderby-limit | The last 5 aggregated time windows before a randomly chosen point in time |
Ingestion performance
| Database | Ingestion throughput (rows/s) |
|---|---|
| InfluxDB v3.11.1 Core | 197,941 |
| InfluxDB v3.11.1 Enterprise | 224,894 |
| GreptimeDB v1.2.0 | 295,424 |
GreptimeDB and InfluxDB used different write parameters. GreptimeDB used a batch size of 3,000 and a write concurrency of 6. InfluxDB 3 kept durable write acknowledgement on, without no-sync or accept-partial; in this synchronous mode a write request takes about 1s to return by default. With the same parameters as GreptimeDB, InfluxDB only reached 18,000 rows/s. To measure InfluxDB's maximum ingestion throughput, we raised its batch size to 25,000 and its write concurrency to 16. The latency of each write stayed at about 1s.
With these parameters, GreptimeDB used smaller batches and lower concurrency and still ingested 31% more rows per second than Enterprise and 49% more than Core.
Query performance
After ingestion finished, we ran the query benchmark against each database with 1 query worker. Each query type ran multiple times and we report the average in ms. For GreptimeDB we also measured a second set of results after one manual compaction, run on the same database:
sql
ADMIN FLUSH_TABLE('cpu');
ADMIN COMPACT_TABLE('cpu', 'swcs', 'window=7200');
window=7200 runs SWCS compaction with a 2-hour data window. See the GreptimeDB 1.2 compaction docs for the syntax.
| Query | InfluxDB v3.11.1 Enterprise | InfluxDB v3.11.1 Core | GreptimeDB v1.2.0 | GreptimeDB v1.2.0 (after manual compaction) |
|---|---|---|---|---|
| cpu-max-all-1 | 10.259 | 538.225 | 24.115 | 12.997 |
| cpu-max-all-8 | 19.887 | 576.350 | 54.490 | 31.760 |
| double-groupby-1 | 1013.684 | 4089.292 | 564.054 | 298.371 |
| double-groupby-5 | 1780.882 | 4308.885 | 776.175 | 446.186 |
| double-groupby-all | 2779.030 | 4602.828 | 1060.180 | 638.032 |
| groupby-orderby-limit | 1235.763 | OOM | 704.118 | 410.691 |
| high-cpu-1 | 3.959 | 823.497 | 17.540 | 13.378 |
| high-cpu-all | 4384.166 | 6747.910 | 4633.307 | 4171.391 |
| lastpoint | 9347.123 | OOM | 2585.120 | 946.952 |
| single-groupby-1-1-1 | 3.628 | 58.032 | 7.483 | 5.881 |
| single-groupby-1-1-12 | 4.337 | 705.723 | 13.051 | 10.058 |
| single-groupby-1-8-1 | 5.945 | 69.245 | 16.568 | 10.687 |
| single-groupby-5-1-1 | 4.475 | 61.952 | 8.088 | 6.649 |
| single-groupby-5-1-12 | 5.846 | 717.083 | 13.816 | 11.479 |
| single-groupby-5-8-1 | 7.543 | 69.285 | 17.883 | 11.839 |
Grouped by how many hosts a query covers, the results split into two sets.
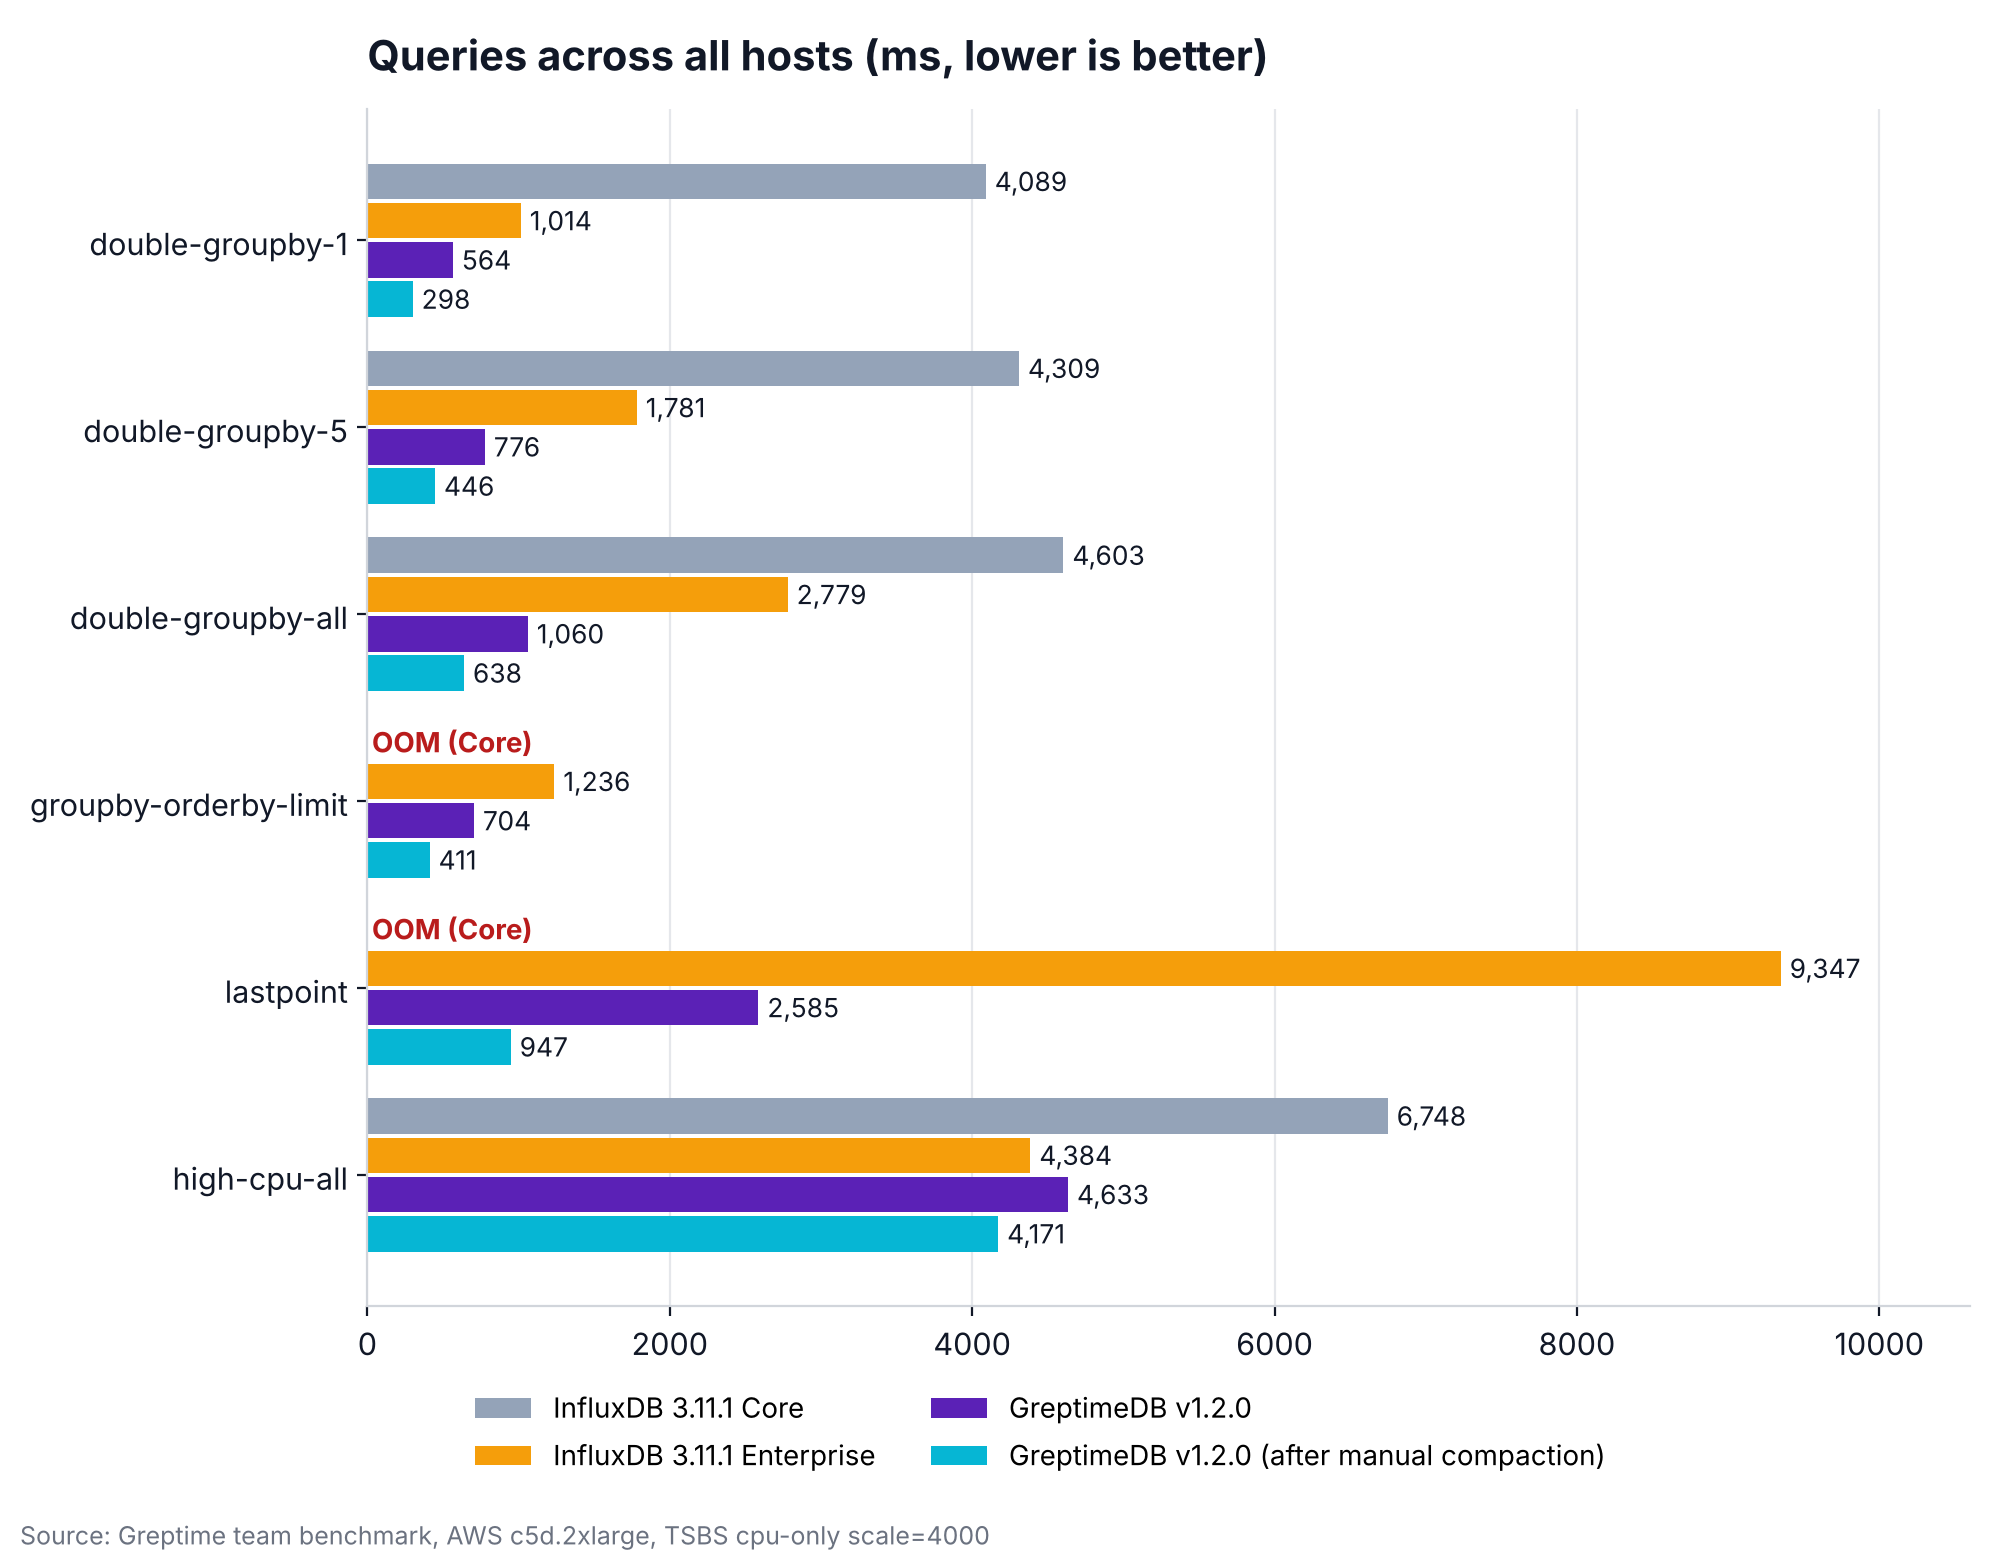
On group-by aggregations, ordering, and lastpoint queries across all hosts, GreptimeDB is faster than Enterprise: 1.8x to 3.6x when queried right after ingestion, and 3.0x to 9.9x after manual compaction. The largest gap is lastpoint, at 9347 ms for Enterprise and 947 ms for GreptimeDB after compaction. On high-cpu-all the two are close: 4384 ms for Enterprise, and 4633 ms for GreptimeDB before compaction and 4171 ms after.
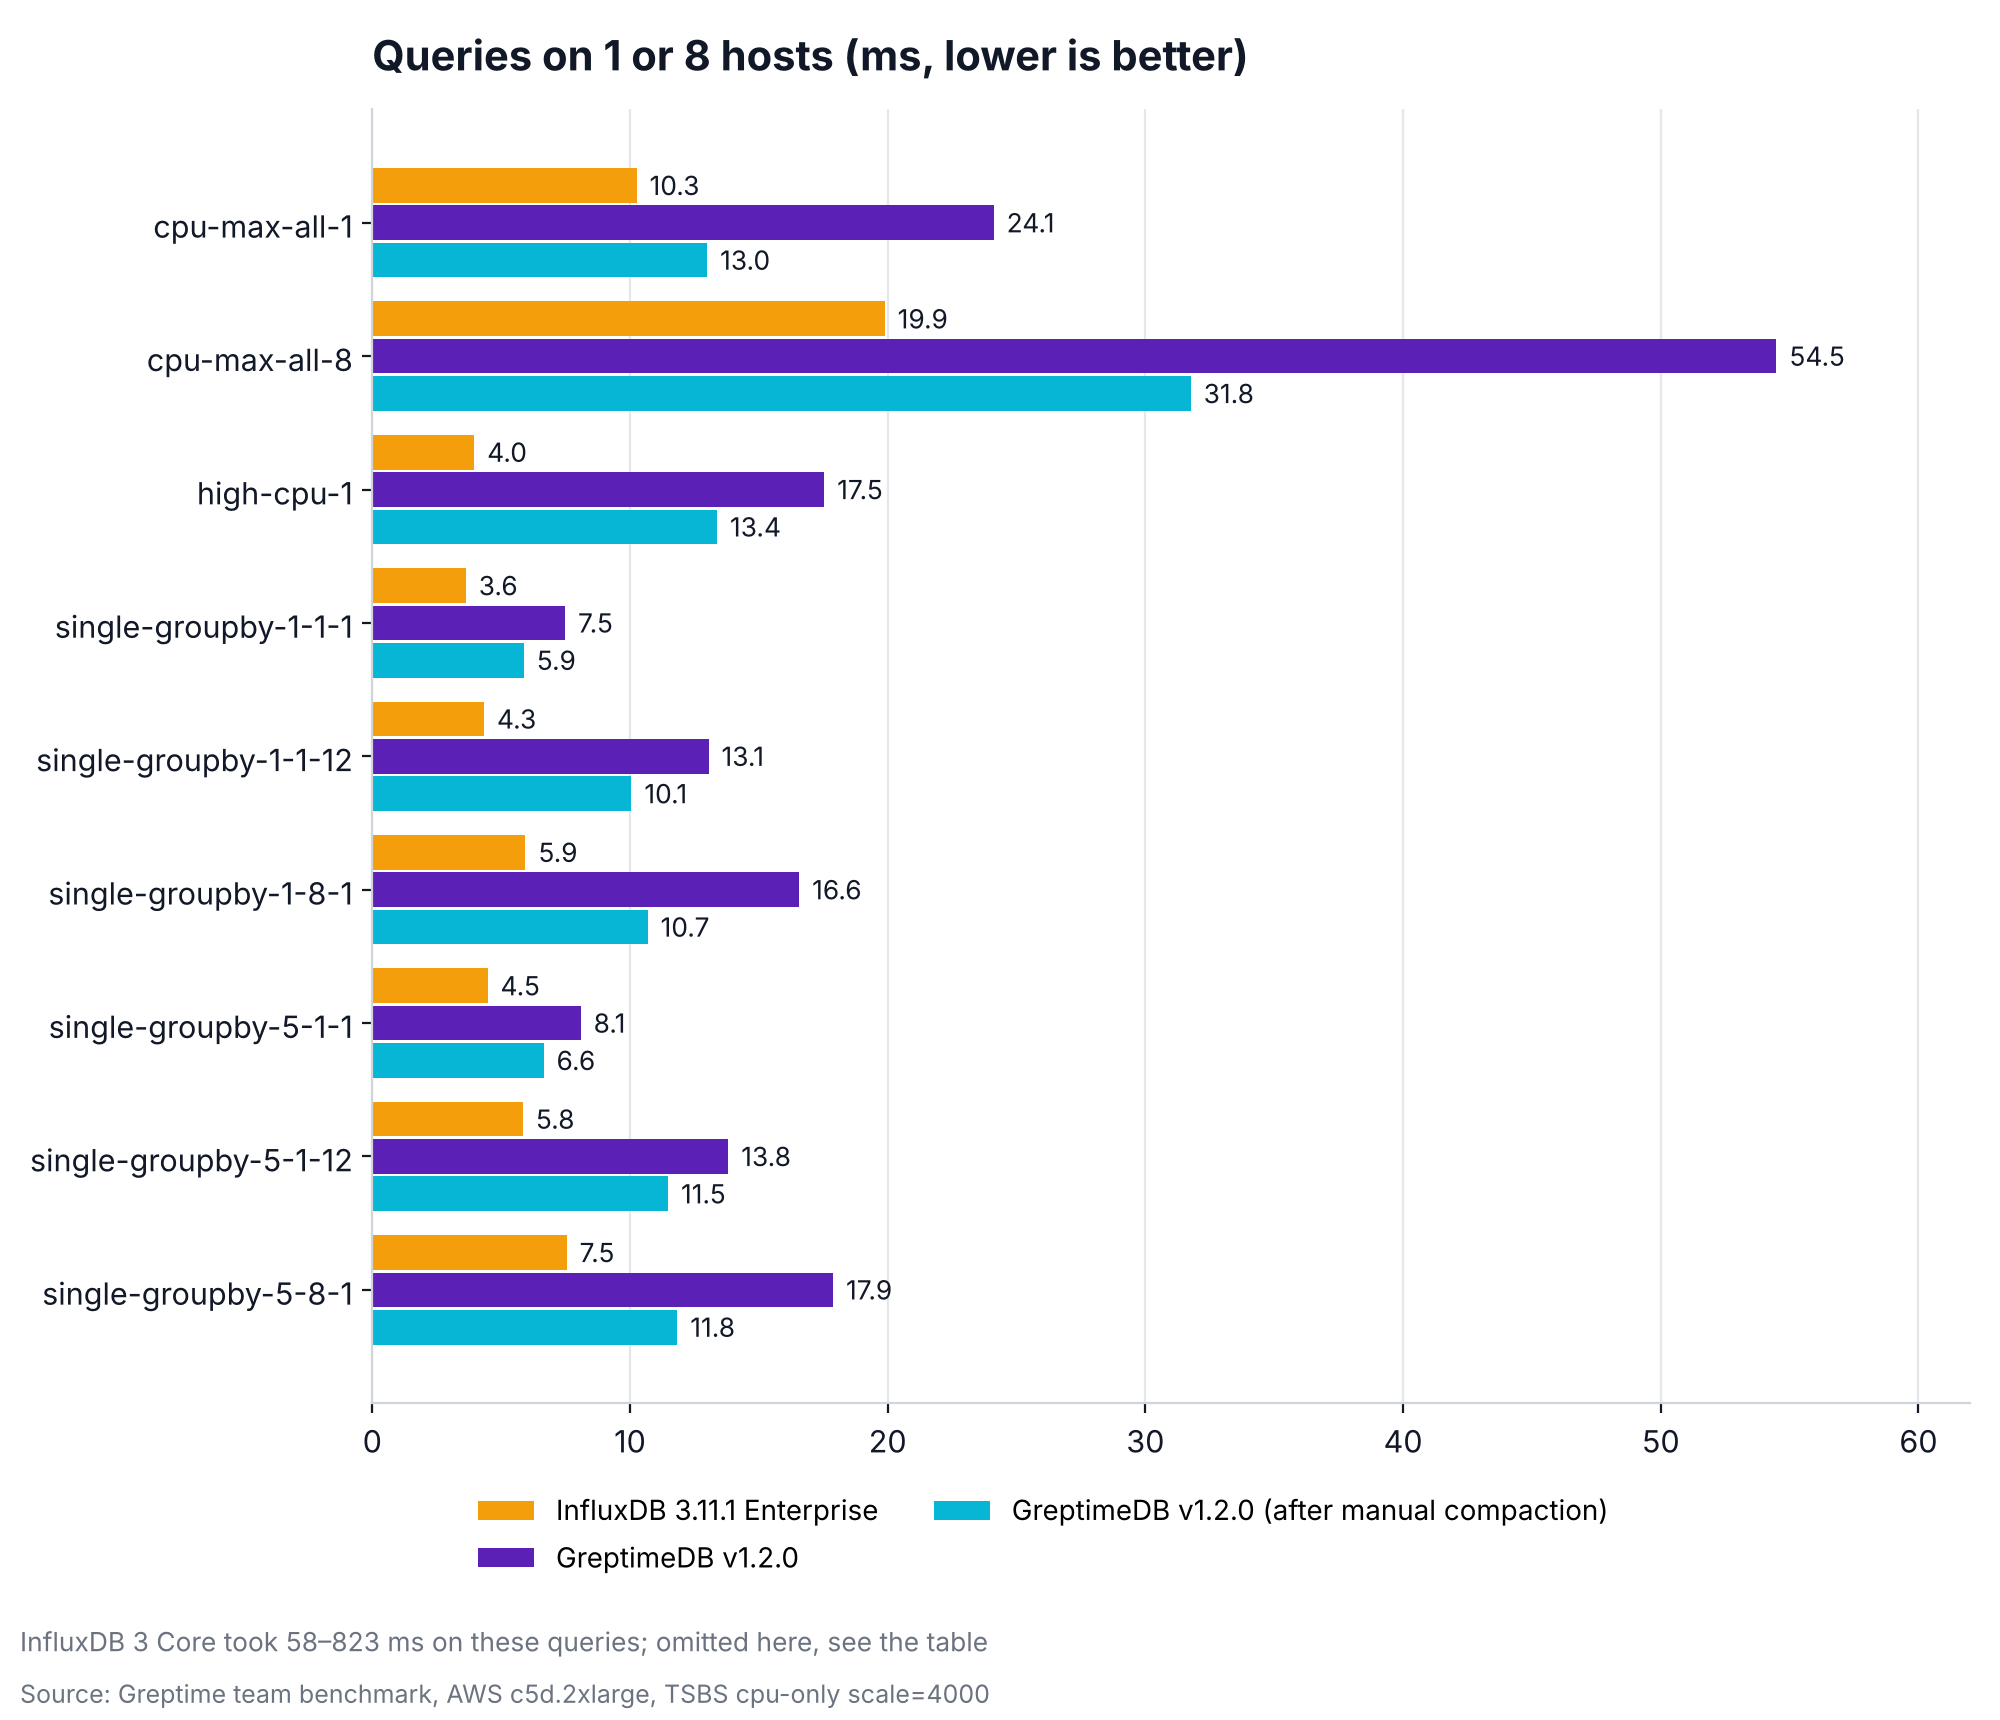
On the 9 query types that touch only 1 or 8 hosts, Enterprise is faster: 1.8x to 4.4x faster than GreptimeDB before compaction, and 1.3x to 3.4x after. Enterprise takes 3.6 to 19.9 ms, against 5.9 to 31.8 ms for GreptimeDB after compaction.
The two gaps differ in scale. Enterprise's lead on the small queries is at most 34.6 ms before compaction and at most 11.9 ms after. GreptimeDB's lead on the all-host queries ranges from hundreds of milliseconds to several seconds; on lastpoint after compaction the difference is 8.4 s.
InfluxDB 3 Core and GreptimeDB both store data as Apache Parquet, yet Core is 1.5x to 54x slower than GreptimeDB before compaction on 13 query types, and it hit OOM on the other 2, groupby-orderby-limit and lastpoint. In this data, storing data in the open Parquet format does not hold back query performance: GreptimeDB is faster than Enterprise on group-by aggregations, ordering, and lastpoint; Enterprise leads on the small queries, by no more than 35 ms in absolute terms. Because it builds on an open format, GreptimeDB Enterprise is also compatible with the Apache Iceberg data-lake format (early preview; see GreptimeDB Enterprise 26.05.1).
Manual compaction cut GreptimeDB's latency by 10% to 63% across the 15 query types, with the largest drop on lastpoint (2585 ms to 947 ms). We will continue to improve compaction under real-time ingestion in GreptimeDB.
Storage footprint
After ingestion finished, we stopped each process and measured the size of its data files:
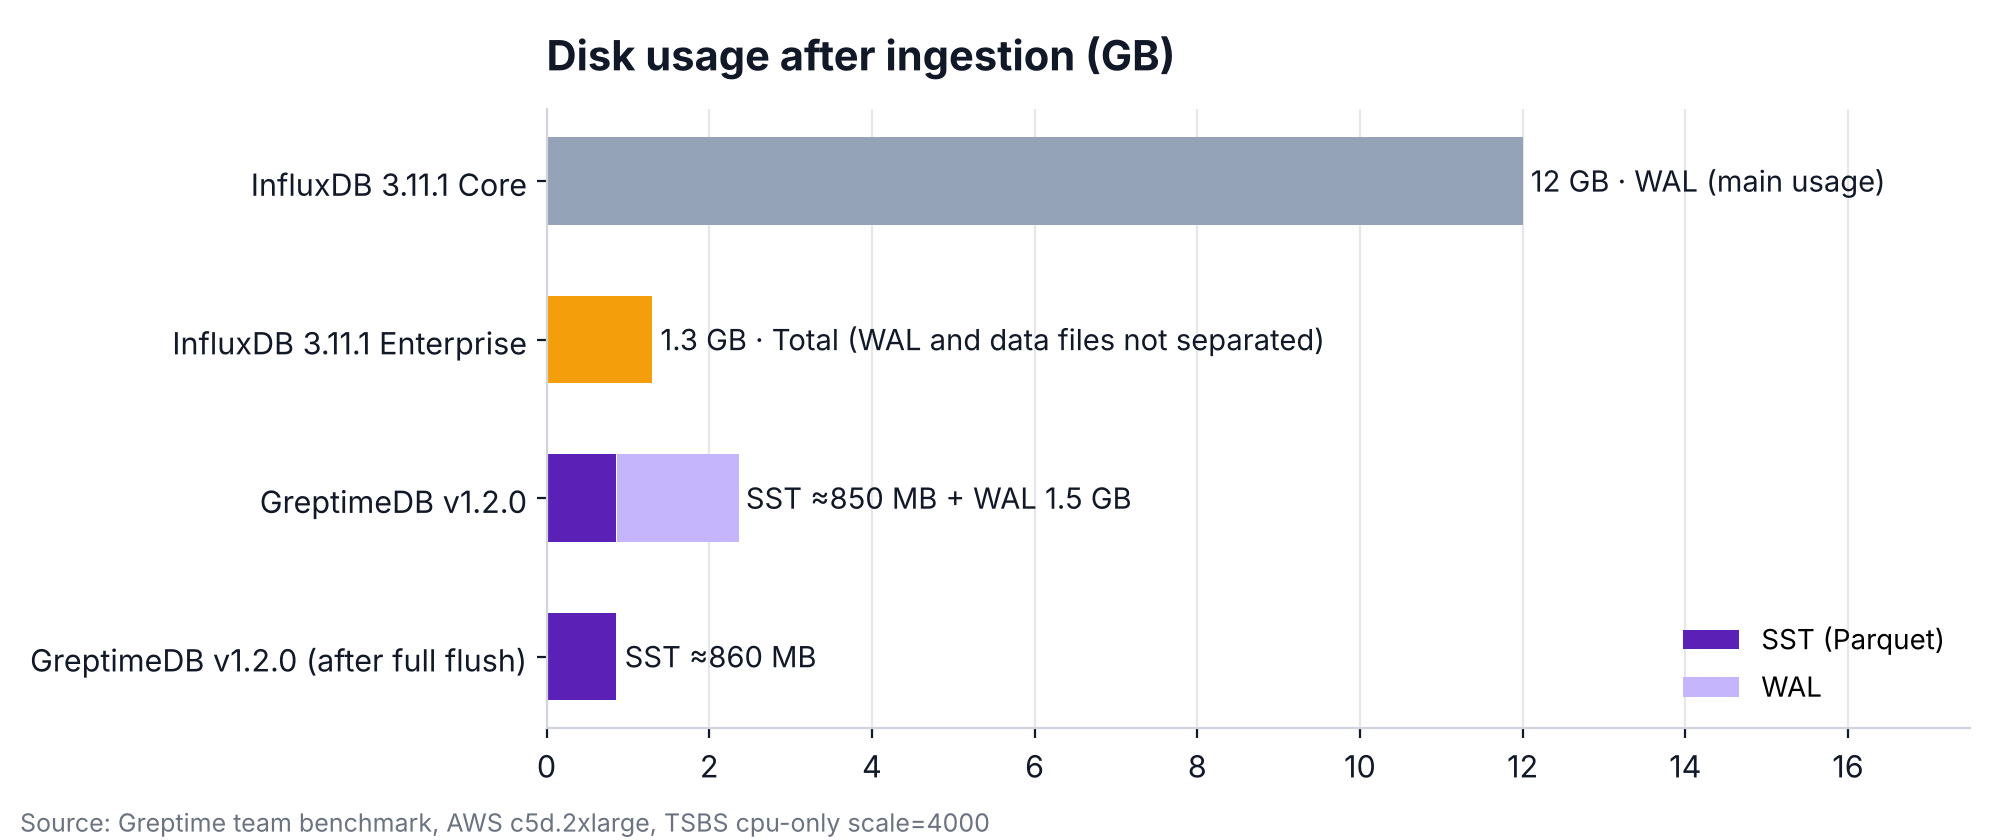
- InfluxDB v3.11.1 Core: mainly 12 GB of WAL.
- InfluxDB v3.11.1 Enterprise: WAL and other data files use the same format and are not separated; 1.3 GB in total.
- GreptimeDB: about 850 MB of SST files (Apache Parquet) and 1.5 GB of WAL.
After flushing all GreptimeDB data to SST files, the SST files took about 860 MB. That is 1,036,800,000 metrics in under 1 GB of Parquet.
How to reproduce
The benchmark uses the TSBS repository maintained by the Greptime team, which ships skills for running it. Clone the repository first:
bash
git clone https://github.com/GreptimeTeam/tsbs.git
cd tsbs
Open a coding agent that can read .agents/skills (for example, Codex) in the tsbs directory and send the prompts below in order. They run the local-file-storage benchmark for GreptimeDB, InfluxDB 3 Core, and InfluxDB 3 Enterprise. Adjust the prompts to fit your test.
You need Python 3. The native platforms supported by all three products are Linux AMD64, Linux ARM64, and macOS ARM64. The environment skill checks for or installs Go.
The prompts pin GreptimeDB 1.2.0, InfluxDB 3 Core 3.11.1, and Enterprise 3.11.1. These are not the skills' built-in defaults. Without an explicit version, the setup skills resolve the latest stable GreptimeDB release or the latest official release of the chosen InfluxDB edition at run time; existing workspaces are not upgraded automatically. Pin the versions for reproducible results.
1. Prepare the environment
text
Use $setup-tsbs-environment to prepare the TSBS build environment for this repository, and confirm the selected Go toolchain is available.2. Prepare the three databases
text
Use $setup-greptimedb and $setup-influxdb3 to prepare the following independent managed database workspaces, all with local file storage:
- GreptimeDB v1.2.0, database-id greptime-120-manual.
- InfluxDB 3 Core 3.11.1, database-id core-3111-manual.
- InfluxDB 3 Enterprise 3.11.1, database-id enterprise-3111-manual.
Confirm the installed versions and workspace paths. Follow the $setup-influxdb3 flow to guide me through activating the Enterprise license locally; remind me when email verification is needed, and do not write the license contents into the conversation.
3. Generate the shared dataset once
text
Use $generate-tsbs-data to generate a shared dataset with the manual profile, influx format, and compression=none (uncompressed).
Reuse a matching dataset if one exists; run verify and return the dataset-id, data path, and checksum.
All three databases will use this dataset; do not generate it separately for each.
4. Run the benchmarks in sequence
Replace <DATASET_ID> with the ID returned in the previous step:
text
Use $benchmark-greptimedb and $benchmark-influxdb3 to run the all phase against these workspaces in order:
1. greptime-120-manual
2. core-3111-manual
3. enterprise-3111-manual

Bind all three databases explicitly to dataset-id <DATASET_ID>, with the manual profile, compression=none (uncompressed), the full query set with the default number of runs, and 1 query worker.
Keep each skill's default write parameters; for InfluxDB, keep durable write acknowledgement and whole-batch rejection, and do not enable no-sync or accept-partial.
Use a separate run directory for each database and run only one database at a time. Reuse matching data that has already loaded successfully to avoid writing it again.
When done, return each run directory and its success or failure status; on failure, keep the diagnostic logs and point to their paths.
The current manual profile write defaults are 6 workers and 3,000 rows per batch for GreptimeDB, and 16 workers and 25,000 rows per batch for InfluxDB 3 Core and Enterprise. The full query set has 15 query types. Keep these write parameter differences in mind when comparing results.
Results are saved to summary.md and summary.json in each run directory. The default run roots are .benchmarks/greptimedb/runs/ and .benchmarks/influxdb3/runs/.
5. Re-run queries on GreptimeDB after manual compaction
After step 4, you can run one manual compaction on the same GreptimeDB database and re-run the queries. The 2 hours here is the data window size, not the benchmark duration; compaction reorganizes the ingested data in place. Compaction runs through admin SQL, and the query re-run uses the query phase of the benchmark skill.
Replace <DATASET_ID> with the ID returned in step 3:
text
Run a manual SWCS compaction with a 2-hour window on the benchmarked greptime-120-manual workspace, then re-run the query benchmark.

Reuse the database, GreptimeDB version, configuration, and data directory bound to the original workspace. While holding the workspace lock and with no other process using the workspace, start the original instance, confirm the ingested cpu table, and run the following in that table's database in order:
ADMIN FLUSH_TABLE('cpu');
ADMIN COMPACT_TABLE('cpu', 'swcs', 'window=7200');
Use the default compaction parallelism. After confirming from the results and logs that compaction completed successfully, stop the instance normally, release the workspace lock, and keep the operation results and logs. If compaction fails or completion cannot be confirmed, stop before the re-run and report why.

Then use the query phase of $benchmark-greptimedb to re-run greptime-120-manual, bound explicitly to dataset-id <DATASET_ID>, reusing the query set from step 4 with the manual profile, compression=none, the full set of query types with the default number of runs, and 1 query worker.
Use the data already in the original database; do not regenerate or re-ingest data, reset the database, or create a copy of it.
Create a new run directory for the post-compaction query measurements and keep the pre-compaction results. When done, return the re-run results directory, the execution status, and the compaction log path.
Using other versions
Replace the versions and workspace IDs in step 2 and use the new IDs in step 4; if you run step 5, replace the GreptimeDB workspace ID there as well. Or send this prompt:
text
Change the GreptimeDB version to <GREPTIME_VERSION>, InfluxDB 3 Core to <CORE_VERSION>, and Enterprise to <ENTERPRISE_VERSION>.
Install the specified versions with the corresponding setup skills, create a separate workspace for each product's new version, reuse dataset-id <DATASET_ID>, and run the manual benchmark in sequence with the same parameters as above.
Record the versions actually run. If a specified version lacks a release package or checksum file for a supported platform, or is incompatible with the current benchmark flow, report why and do not switch to another version automatically.
References
- TSBS: https://github.com/GreptimeTeam/tsbs
- GreptimeDB 1.2 compaction docs: https://docs.greptime.com/1.2/user-guide/deployments-administration/manage-data/compaction/#strict-window-compaction-strategy-swcs-and-manual-compaction
- InfluxDB 3 Enterprise storage engine docs: https://docs.influxdata.com/influxdb3/enterprise/reference/internals/storage-engine/
- GreptimeDB vs. InfluxDB v2 benchmark (2024): https://greptime.com/blogs/2024-08-07-performance-benchmark


