
On this page

At Apache Community Over Code EU 2026 in Glasgow, engineers from OpenAI's data platform gave two talks on running Apache Spark at their scale: "Operating Apache Spark at OpenAI's Hyperscale Lakehouse" and "Beyond the Spark UI: Building Agent-Native Observability at OpenAI" (below, the lakehouse talk and the agent-native talk). Both recordings are public, and both describe how GreptimeDB ended up in their Spark observability stack.
This post is our reading of the two talks. Everything about OpenAI's systems comes from what the speakers said on stage, with timestamps so you can check it against the recordings. Where we add our own view, we say so.
The scale
The lakehouse talk opens with the numbers (15:27). OpenAI runs Spark on two clouds, Azure and AWS, over multiple exabytes of data. Hundreds of thousands of Spark applications run every day, which translates to tens of millions of Kubernetes pods per day. Reads from S3 and Azure Blob Storage average several terabytes per second, and the Celeborn shuffle service moves on the order of a hundred terabytes per second across all workloads.
The speakers grouped the challenges into four areas (17:38): the Kubernetes control plane, cloud quotas and S3 throttling, observability, and operational burden. This post covers only the observability part; the recordings cover the rest.
Three questions behind every slow job
The agent-native talk frames Spark observability as three questions (0:16): which run are you talking about, where did the time go, and what changed.
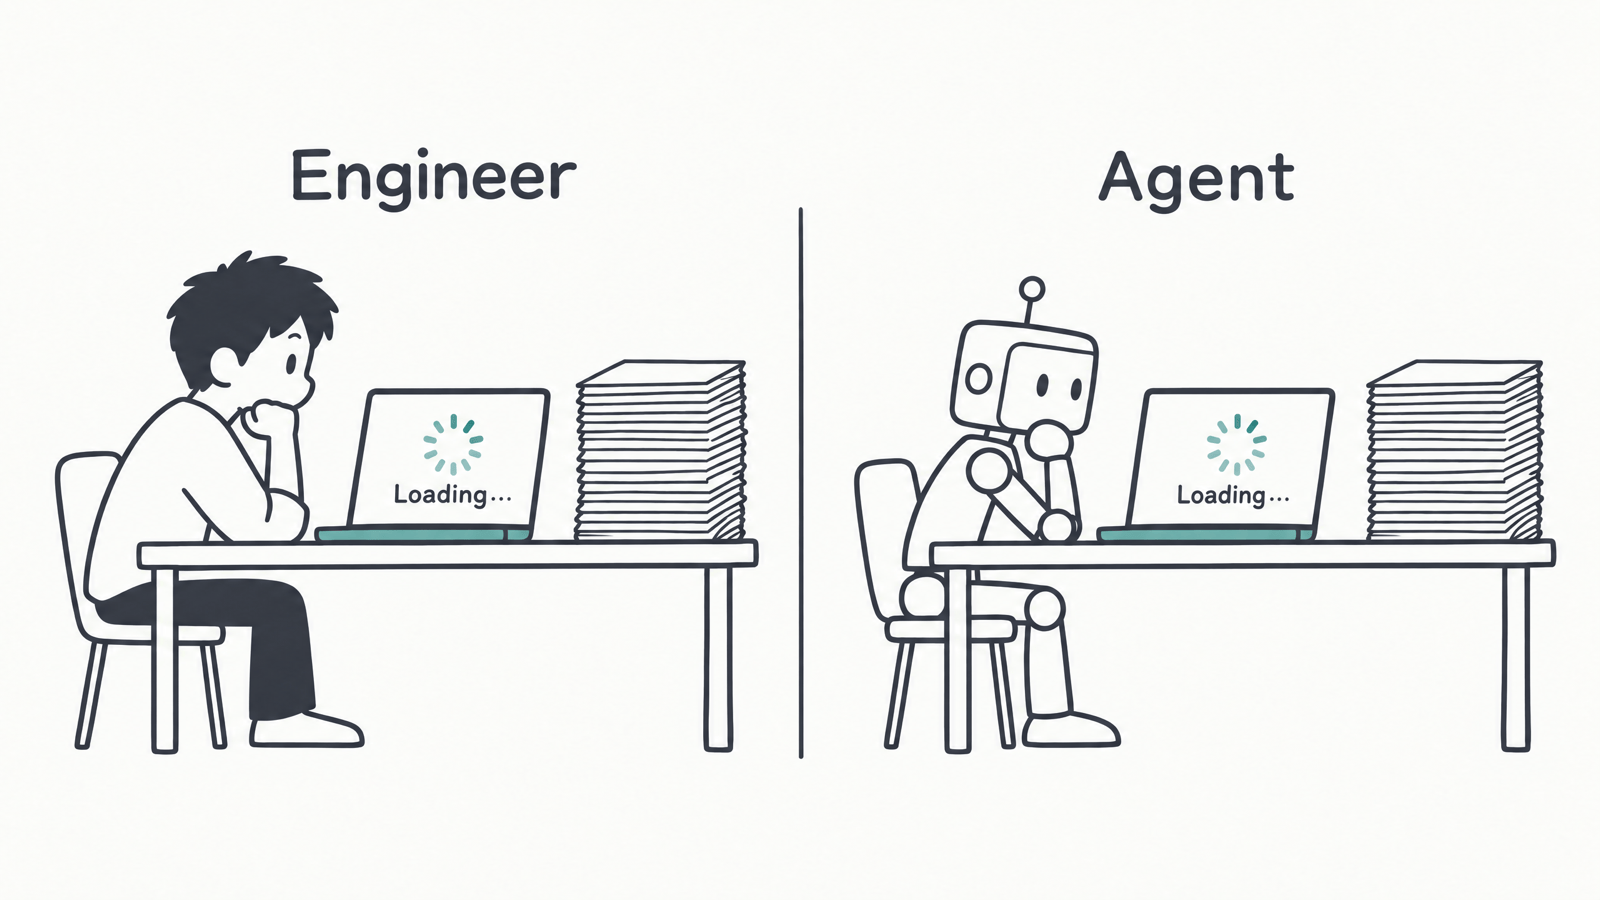
Answering them at OpenAI's scale was slow. Some applications routinely produce more than 100 GB of event logs, and opening one of them in the Spark History Server could take up to half an hour before the first page rendered (1:15). Once they started building agents for Spark questions, every agent tool call waited on that same load (1:35).
Their system went through four steps.
Step 1: make the event logs queryable
When a job finishes, OpenAI's gateway service publishes a Kafka event. A Flink job consumes it, reads the event logs from S3, parses them, and writes one Kafka topic per entity, which existing infrastructure loads into Delta tables (3:14). The keys come from Spark's own app status store, so job, task, executor, and SQL execution IDs line up with the Spark UI (4:58).
These tables answer cross-application questions: which stages spilled the most yesterday, or the five most common failure reasons last week (5:28). The History Server itself was still unchanged.
Step 2: make the History Server fast
The slow part was replay. The History Server decompresses and re-parses every event log line to rebuild the same key-value store the live UI already had while the driver was running (5:46).
So the driver now writes that state to S3 as a snapshot when the application finishes, with a manifest written last as the commit point (8:23). The History Server restores the snapshot directly and falls back to event log replay only if the snapshot is missing or invalid. On Spark 3.5 in production, P90 load time improved about 10x and P99 about 30x (9:25).
They then rewrote the History Server in Rust, on prost, tokio, and axum. On top of snapshots, first loads got about 3x faster and navigation about 2x (10:15). The snapshot work was proposed upstream as SPARK-56093. At the time of the talk the PR had gone stale and OpenAI had moved on from snapshots, and the speakers invited others to pick it up (21:21). On October 22, the author opened a new PR, #59696, which is still under review.
Step 3: put agents on the same evidence
The second half of the agent-native talk is about who reads this data now. Agents became the routine first step in Spark investigations, for both debugging and tuning (18:08).
Raw tools were not enough. With only MCP servers and a CLI, agents tended to over-fetch data and reach weak conclusions, so the team wrote bounded skills (13:15). A skill first asks what the user is trying to debug, a failure or a performance problem, before it spends tokens (14:52). A script behind the skill checks what a human would: skew, partition counts, spill, shuffle, GC, and UDF use (15:58). Because Spark jobs live in a monorepo, Codex can also trace a job ID back to the Airflow DAG and the code that submitted it (13:35).
Step 4: GreptimeDB
The talk was written around February. About three months after submitting it, the team switched to GreptimeDB, "just because we found that it was more effective" (19:02, 29:44).
Today a custom GreptimeDB listener in the Spark driver forwards structured records, covering applications, jobs, stages, tasks, executors, and SQL execution plans, to a cluster-local Grafana Alloy, which batches and retries them into GreptimeDB (19:14). The History Server reads from GreptimeDB instead of S3 snapshots (20:23). The slide describing this step calls it "live, selectively queryable Spark state".
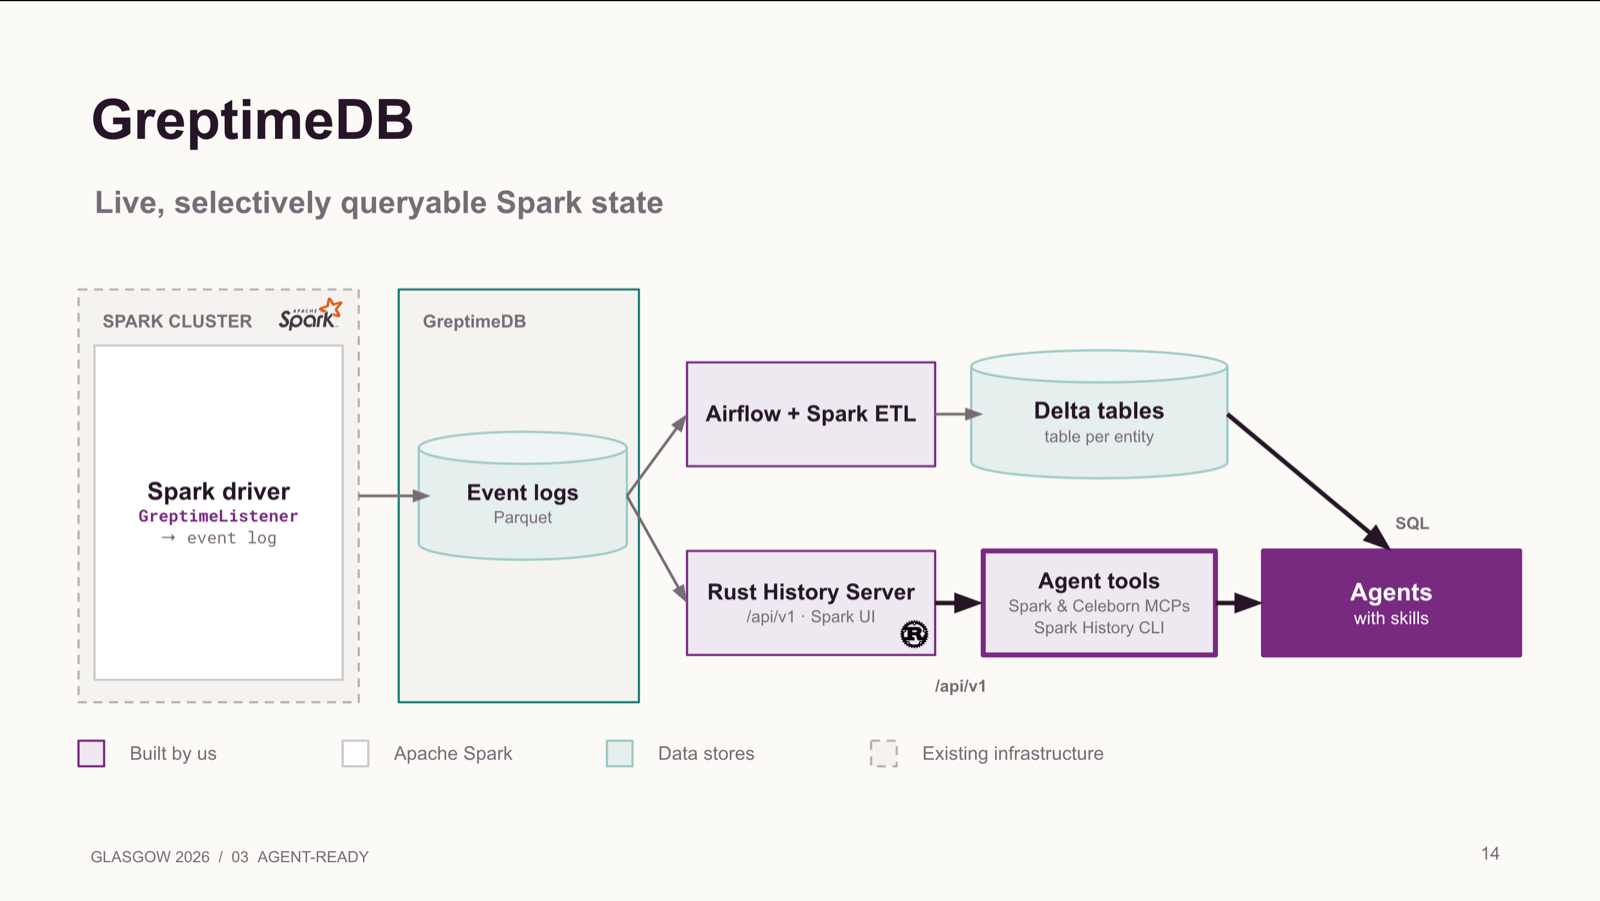
The speakers gave their reasons (19:51): GreptimeDB consolidates event logs and metrics into one system, and the data is backed by Parquet, so the raw data is already queryable with Spark. They still ETL data out of GreptimeDB into denormalized Delta tables.
It also removed a pipeline. The Flink job that parsed event logs was, in the speakers' words, "probably one of the most expensive Flink apps at OpenAI", and handling skew in it was particularly difficult. With the new path they "don't really need Flink anymore" (20:28).
In Q&A they added two details. GreptimeDB keeps about two weeks of data for querying and debugging, long enough to compare weekly jobs across runs, while aggregate statistics in Delta are kept for 90 days (23:35). And they were careful not to prescribe the setup: jumping directly to GreptimeDB "may not be a good fit for everyone", and some teams may want to start with something easier and more accessible (28:02).
The same choice, from the infrastructure side
The lakehouse talk reaches GreptimeDB from a different direction.
The speaker wanted metrics for every Spark task: how much data a task read and wrote, and how long it took (19:43). One time series per task means millions to tens of millions of new series per day, and billions over a year. In the speaker's account, none of the systems they already ran could handle that cardinality (21:02).
The second problem was fragmentation. Logs, metrics, and events lived in different storage systems, so correlating them during an incident or a performance investigation had no good answer (29:58).
To address both, they chose GreptimeDB (30:44). GreptimeDB stores Spark metrics, events, and logs; CPU and memory profiles go to Pyroscope, which the speaker described as the only signal GreptimeDB does not support today (31:00); see #6760 for profile support. Grafana Alloy collects the data. Grafana and the Rust Spark History Server read from GreptimeDB. And because GreptimeDB stores data on S3 in Parquet, the team can export it or map it into Parquet, Iceberg, or Delta Lake tables and analyze it with Spark and Trino (31:51).
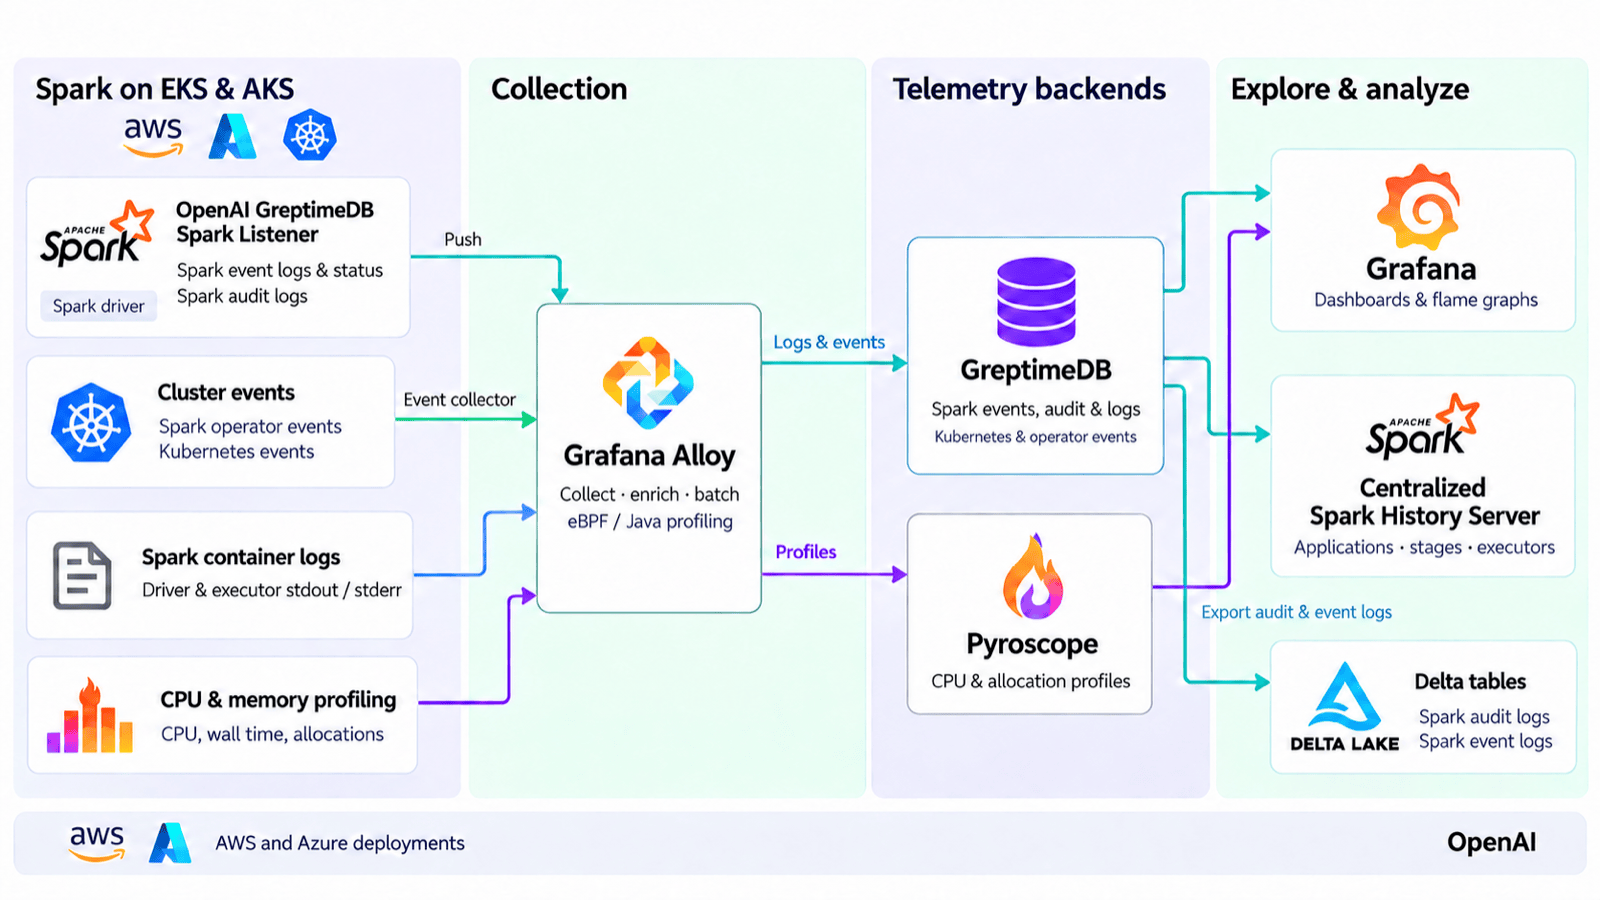
The architecture slide also shows what else lands in GreptimeDB besides Spark events and logs: Spark audit logs, plus Spark operator and Kubernetes cluster events. Audit and event logs are then exported to Delta tables.
The talk closes with operations. Alongside a set of Kubernetes operators, the team runs an internal agent called Yoda. It pulls data from GreptimeDB and other systems to answer users' questions about slow or failed jobs in Slack, and helps with root cause analysis when an alert fires (33:39).
What we take from it
The rest of this post is Greptime's view, not OpenAI's.
Cardinality and fragmentation arrived together. The lakehouse talk names them as two separate problems, but they share a cause: once observability data is fine-grained enough to be useful (per task, not per job), the number of series outgrows storage that keeps its indexes in memory, which is how the speaker described traditional observability systems (19:47), and splitting the data by signal type makes the correlation an investigation needs harder. A store that handles both is solving one problem, not two.
Each step removed a copy. Replay rebuilt state the driver already had. Snapshots saved that state once. Writing live records into a queryable store removed the Flink parse-and-load pipeline. The direction across the four steps is toward data that lands in one place, a single source of truth, with fewer pipelines moving it around.
Agents made latency to evidence a hard requirement. A human can wait half an hour for a History Server page once. An agent making dozens of tool calls cannot. The team's response was not only faster storage but bounded skills that decide what to fetch. Both matter, and the second is not something a database solves; it comes from the team turning its debugging experience into skills.
Open formats let observability and the lakehouse share data. The Parquet files GreptimeDB writes are the same format the rest of OpenAI's lakehouse reads. Spark and Trino can query the raw observability data directly, and the denormalized Delta tables are now built from GreptimeDB rather than from a separate parsing pipeline.
We wrote about the database side of this in Observability Database: Should the Database Understand Telemetry?. These two talks describe the same problems independently, from a team running production at this scale.
Thanks to the speakers for sharing their work with the community. If anything here misstates what was said in the talks, let us know and we will correct it.


