On this page
This article is based on an interview with the co-founder of NexusGPU PTE. LTD. and was written collaboratively by the Tensor Fusion and Greptime teams.
NexusGPU is an AI infrastructure startup founded in January 2025. Its core open-source project, Tensor Fusion, is designed to virtualize and pool GPU resources so organizations can slice, share, and allocate compute on demand. The goal is straightforward: make GPU capacity feel less like fixed hardware and more like a utility.
This post looks at how the team approached observability from the start, why they chose GreptimeDB for private-cloud deployments, and what actually matters when a small team is picking foundational infrastructure.
Why GPU Virtualization Needs Strong Observability
As AI adoption expands, GPUs have become one of the most expensive and operationally constrained resources in modern infrastructure. The problem is not just scarcity. It is utilization.
A physical GPU is not naturally easy to divide. In practice, that leads to two familiar failure modes: teams wait in line for capacity, or expensive hardware sits underused. Tensor Fusion was built to address exactly that. By virtualizing GPUs and pooling them across workloads, it allows a single physical device to be split into multiple vGPUs, allocated dynamically, shared across tenants, and reclaimed when demand changes.
But once GPU allocation becomes dynamic, observability stops being optional. It becomes part of the control plane.
The Tensor Fusion team needed near-real-time visibility into:
- VRAM usage and compute headroom for each physical GPU
- Resource allocation for every vGPU worker, including the physical GPU it was assigned to
- Capacity, saturation, and overcommit ratios across the GPU pool
- The full context behind scale-up and scale-down events
That data supports day-to-day operations, but it also serves another purpose: billing. In a system where compute is allocated dynamically, observability data becomes the source of truth for usage-based metering.
For this kind of product, observability is not just about debugging. It is part of how the business works.
What the Team Optimized for on Day One
The Tensor Fusion team came into the project with prior experience in cloud platforms and SRE. That shaped how they thought about observability from the beginning.
As they put it:
"We'd been paged at 3 a.m. because of Prometheus high-cardinality issues. We'd also seen distributed storage systems create more operational burden than value. We didn't want to repeat those mistakes."
GPU observability is naturally high-cardinality. Every physical GPU, vGPU worker, namespace, pod, and workload adds another dimension. That puts immediate pressure on a database's write path, indexing strategy, and operational model.
The team also knew they were not choosing for just one stage of the company. They needed a system that worked across three very different phases:
| Phase | What they needed |
|---|---|
| Development and testing | A standalone instance that could be brought up locally with minimal setup |
| Production rollout | A self-hosted deployment model suitable for customer-owned private cloud environments |
| Growth | A path to enterprise support for larger customers |
Each requirement is manageable on its own. Covering all three with one system is harder.
Many tools work well in one or two of those environments but break down somewhere else: too heavy for local iteration, too complex for customer self-hosting, or too limited when larger deployments arrive.
The team discovered GreptimeDB through the Vector community and GitHub. After evaluating options, three things stood out:
- a relatively clean operational model
- strong support for high-cardinality time-series workloads
- a single system that could handle metrics, logs, and event data together
That combination mattered more than a long feature list. What Tensor Fusion wanted was not the most feature-rich stack. It was a system that would still make sense six months later, without forcing a redesign.
The Observability Architecture
Tensor Fusion's observability pipeline is built around two write paths into GreptimeDB.
GPU Hypervisor (metrics source)
        │
        ├── Vector sidecar (log normalization + metrics forwarding)
        │         │  InfluxDB Line Protocol
        │         ▼
        └── Go SDK direct write (critical scheduling events)
                  │  InfluxDB Line Protocol
                  ▼
              GreptimeDB (self-hosted)
                  │
                  ▼
          Management Dashboard (Grafana)
The Vector sidecar collects container logs and system metrics, normalizes them, and forwards them to GreptimeDB using InfluxDB Line Protocol. The Go SDK writes critical scheduling events directly, also through InfluxDB Line Protocol.
On the read side, the team mainly uses SQL. That turned out to be a good fit for billing queries, usage aggregation, and time-window analysis. They did not need PromQL or Flux for their main workloads. Standard SQL covered the operational and business queries they cared about.
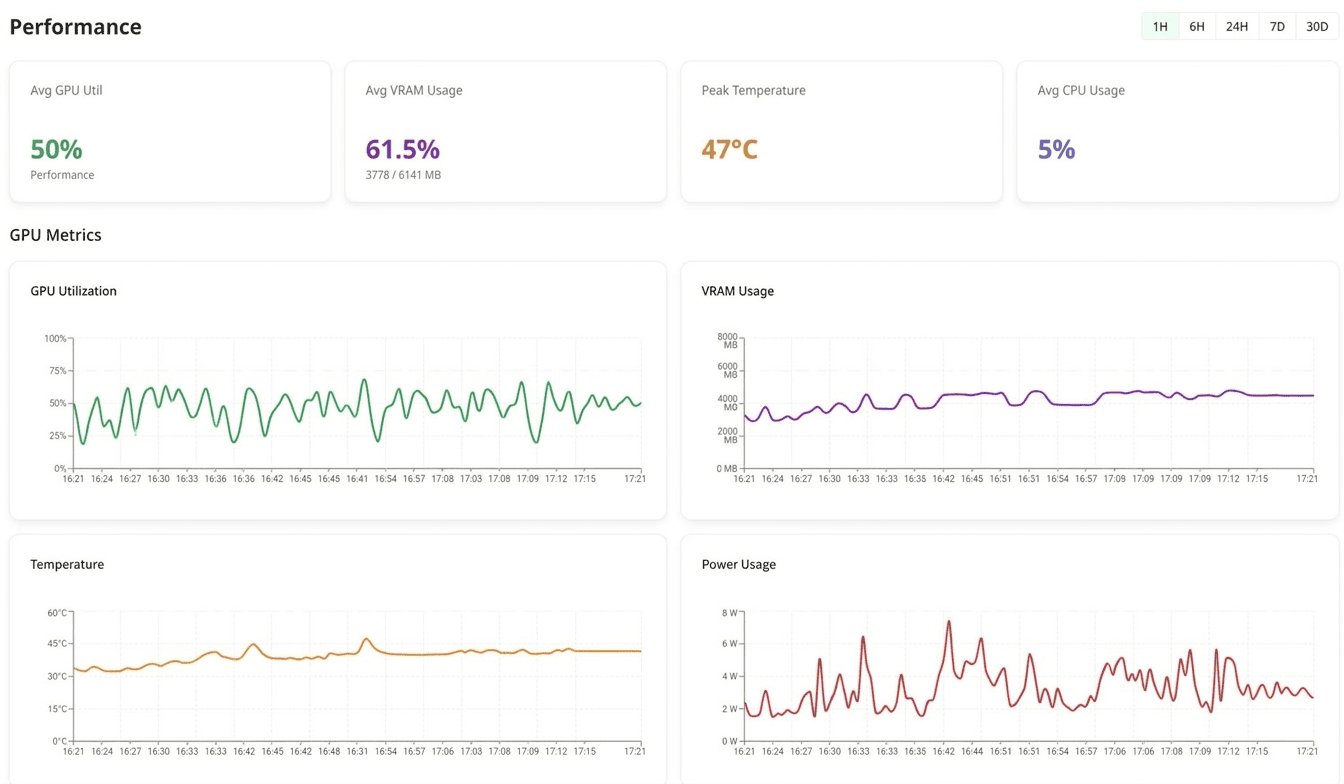
Three Layers of GPU Metrics
Tensor Fusion collects metrics every minute across three core tables:
tf_gpu_usage: physical GPU utilization, including VRAM consumption and compute utilization by devicetf_worker_usage: resource usage at the vGPU worker level, tied to workloads and namespacestf_worker_resources: scheduling events such as scale-up and scale-down activity, assigned GPU IDs, and changes in resource allocation
Together, these tables provide the basis for capacity planning, overcommit visibility, autoscaling decisions, and usage metering.
That mix is important. The team was not building dashboards for GPU health alone. They needed the same data model to support both operations and billing.
Logs as the System-of-Record for Pod Lifecycle
Metrics tell part of the story, but many scheduling issues only become clear when you reconstruct the full event chain.
Tensor Fusion ships container stdout through Vector into GreptimeDB and uses logs to follow a GPU pod from creation to ready state. A typical lifecycle spans multiple components, including AdmissionWebhook, Operator, Scheduler, CUDALimiter, and RemoteGPU worker.
One of the team's most useful query patterns is rebuilding that cross-component sequence in a single query. That makes it much easier to investigate scheduling anomalies, allocation failures, and unexpected startup delays.
In practice, this is where the "one database" approach starts to pay off. Metrics show symptoms. Logs and scheduling events provide the sequence that explains them.
Deployment Model
Tensor Fusion primarily serves customers in private cloud environments, so GreptimeDB is deployed as a self-hosted component.
For development, the team uses a Helm-based standalone deployment that can be brought up with a single command (see greptime-standalone.yaml). In production, deployments scale according to customer requirements. Their default retention policy is 30 days.
That deployment model aligned well with how the company needed to operate: simple enough for fast local iteration, but still suitable for customer-managed environments.
Lessons Learned
The most useful part of the team's experience may be the problems they ran into along the way.
1. Tag key ordering in the InfluxDB Line Protocol Go SDK
Symptom: intermittent write failures when using github.com/influxdata/line-protocol/v2/lineprotocol.
Root cause: the encoder runs in strict mode by default and expects tag keys to appear in lexical order. If they do not, encoding fails before the data ever reaches GreptimeDB.
Fix: enable lax mode during initialization.
go
enc := lineprotocol.Encoder{}
enc.SetPrecision(lineprotocol.Millisecond)
enc.SetLax(true)
This was not a GreptimeDB issue. It was an SDK-side behavior that surfaced during integration.
2. Semantic type conflicts across multiple write paths
Symptom: after manually pre-creating tables with an explicit schema, writes from Vector and the Go SDK began to fail.
Vector produced errors like this:
WARN vector::sinks::util::retries: Retrying after error.
error=status: InvalidArgument,
message: "Invalid request to region 4793183502336(1116, 0),
reason: column uuid has semantic type Field, given: TAG(0)"
Root cause: different writers interpreted the same column differently. In this case, Vector treated uuid as a field, while the Go SDK wrote it as a tag. Once the schema was pre-created, GreptimeDB enforced that interpretation and rejected writes that did not match it.
Fix: stop manually creating the tables and let GreptimeDB infer the schema from incoming data on first write.
The broader lesson was simple: when multiple ingestion paths are active, hand-maintaining schema becomes fragile very quickly. During early iteration, auto-creation was the more practical choice.
3. PostgreSQL driver issues in Cloudflare Workers
Symptom: repeated connection failures when trying to connect to GreptimeDB from a Cloudflare Worker using a standard PostgreSQL driver.
Root cause: Cloudflare Workers run in a V8-based serverless environment that does not allow arbitrary outbound TCP sockets. Standard PostgreSQL drivers rely on TCP and therefore do not work there.
Fix: use Cloudflare Hyperdrive, which manages pooled database connections on Cloudflare's side and exposes a PostgreSQL-compatible interface to the Worker.
Again, this was less about GreptimeDB itself than about the runtime environment around it.
What the Team Got Out of the Design
Billing without adding a stream processing stack
Usage-based billing is central to Tensor Fusion's model. By combining time-series aggregation with SQL, the team was able to compute fine-grained usage directly from scheduling events and resource data.
At this stage, that meant no Kafka, no Flink, and no separate metering pipeline. For a small team, fewer moving parts mattered.
One system instead of three
GreptimeDB stores metrics, logs, and scheduling events in one place. That removed the need to stitch together separate systems for monitoring, log management, and event storage.
For private-cloud deployments, stack size matters. Every extra component is another service a customer has to deploy, operate, upgrade, and debug.
Faster local development
The team could bring up a working local instance from a single YAML-based setup rather than standing up a full distributed stack just to validate a feature.
For an early-stage engineering team, that shortens the feedback loop in a way that is easy to underestimate.
What Comes Next
Tensor Fusion currently uses Grafana for dashboards, but the team's longer-term goal is to simplify the visualization layer as well. Ideally, they want something lighter-weight and more directly integrated with GreptimeDB for both visualization and alerting.
That is a familiar pattern in private-cloud software: the fewer components customers need to run, the better.
Closing Thoughts
Tensor Fusion's experience highlights a practical truth about infrastructure choices at an early-stage company.
The question is usually not, "What is the most feature-complete system available?" It is, "What can we adopt now without painting ourselves into a corner later?"
For Tensor Fusion, that meant choosing a database that worked in local development, fit private-cloud deployment constraints, and still offered a path forward as customer requirements grew. GreptimeDB's value was not just in individual features. It was in reducing the chance that the observability stack would need to be rethought a few months later.
For a small team moving quickly, that kind of continuity can matter more than a longer checklist.
About Tensor Fusion: tensor-fusion.ai | GitHub
Give it a star and help make GPU compute as accessible as electricity.


