On this page
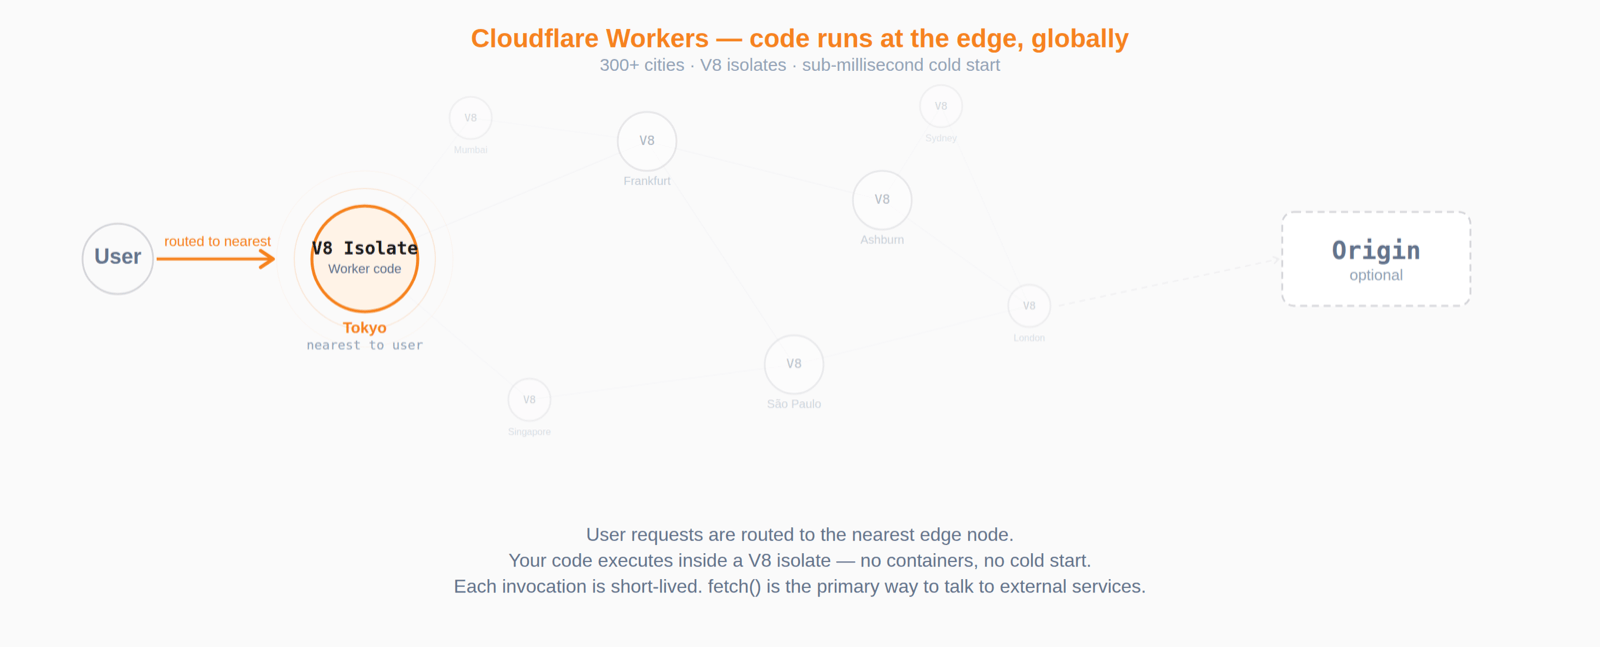
Cloudflare Workers run your code at the edge — close to your users, across Cloudflare's global network, with sub-millisecond startup. If you haven't used them before, think of Workers as lightweight serverless functions that execute inside V8 isolates instead of containers. They're great for request routing, API backends, and middleware, but they come with constraints: short-lived invocations, no traditional server processes, and a runtime that differs from Node.js in meaningful ways.
When you need to record what your Worker is doing — request logs, latency metrics, error traces — the built-in Cloudflare options can be limiting. D1 is SQLite at the edge, designed for relational app data rather than high-volume time-series ingest. Workers Analytics Engine provides lightweight analytics but enforces cardinality limits and uses lossy sampling — you can't run arbitrary SQL over raw events. Neither gives you a "full-fidelity event store with flexible queries" experience.
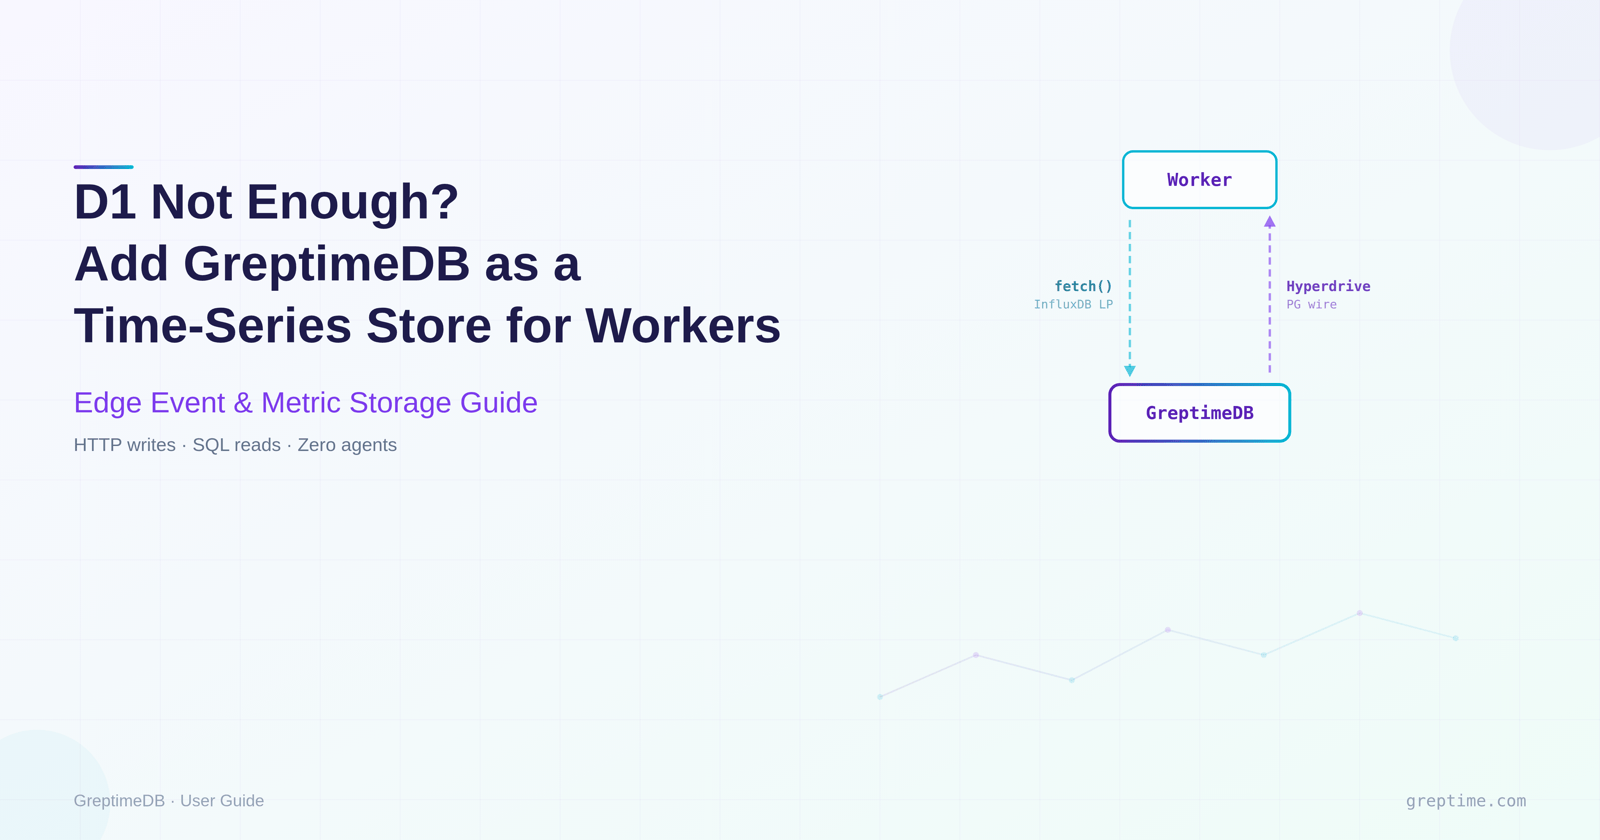
GreptimeDB fills that gap. It accepts writes over HTTP (InfluxDB line protocol) and reads over the PostgreSQL wire protocol. Both protocols work from Workers: writes use plain fetch(), reads go through Cloudflare Hyperdrive which handles connection pooling. This guide walks through the setup: writing request events from a Worker to GreptimeDB, querying them back, and building dashboards on top.
If you've followed our Tensor Fusion user story, you'll recall that their team hit a wall connecting to GreptimeDB from Cloudflare Workers using a standard PostgreSQL driver — the Workers runtime doesn't support arbitrary outbound TCP sockets in the same way Node.js does. Hyperdrive was their fix, and this guide shows the pattern end-to-end.
We'll use a working demo that runs entirely in docker compose. Follow along locally, then deploy the same Worker to Cloudflare's edge when you're ready.
Architecture
The setup splits writes and reads into two paths, each using a protocol that works well inside Workers:
  ┌──────────────┐
  │   Client     │
  └──────┬───────┘
         │ request
         ▼
  ┌──────────────┐        POST /v1/influxdb/...        ┌──────────────┐
  │  Cloudflare  │ ─────── write path ──────────────▶  │  GreptimeDB  │
  │    Worker    │                                     │              │
  │              │ ◀──────  read path  ─────────────── │              │
  └──────────────┘    Hyperdrive + postgres.js         └──────────────┘
                            (PG wire)
Write path. The Worker builds an InfluxDB line-protocol string and POSTs it to GreptimeDB's HTTP endpoint via fetch(). While Workers do support outbound TCP sockets via cloudflare:sockets, HTTP is simpler and doesn't require managing connection lifecycles.
Read path. The Worker connects to GreptimeDB's PostgreSQL wire interface through Hyperdrive. Hyperdrive maintains a connection pool close to your database, so each Worker invocation avoids the full TCP+TLS handshake cost. We use postgres.js, a supported driver on the Hyperdrive postgres.js integration page.
Quick start
bash
git clone https://github.com/GreptimeTeam/demo-scene.git
cd demo-scene/cloudflare-workers
docker compose up -d
This starts GreptimeDB (HTTP :4000 / PG wire :4003), a local httpbin origin, a Worker under wrangler dev (:8787), and Grafana with a pre-provisioned dashboard (:3000).
Generate some traffic and query it back:
bash
curl http://localhost:8787/anything
curl http://localhost:8787/status/404
for i in {1..100}; do curl -s http://localhost:8787/anything?i=$i > /dev/null; done
bash
# Query via the Worker's read path
curl "http://localhost:8787/_stats?window=5" | jq
Output of _stats:
json
{
"colo": "LAX",
"window_minutes": 5,
"rows": [
{
"path_group": "/anything",
"requests": "100",
"p95_ms": 1,
"errors": "0"
},
{
"path_group": "/status/:id",
"requests": "1",
"p95_ms": 1,
"errors": "1"
}
]
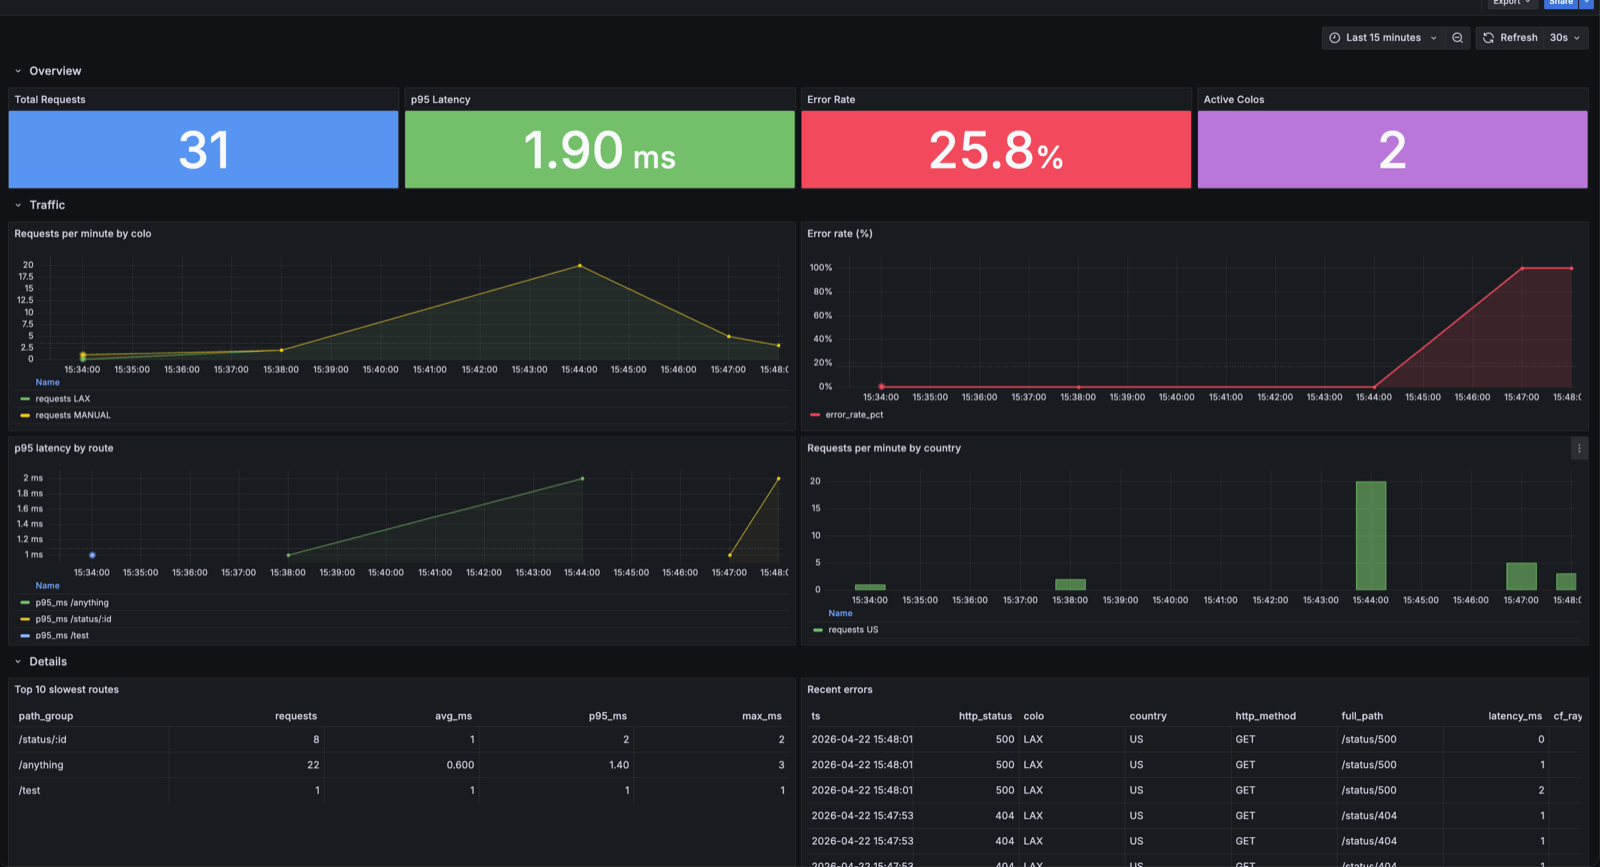
}Open Grafana at http://localhost:3000. The Edge Traffic dashboard shows request rates, latency percentiles, and error breakdowns in real time.
The write path: InfluxDB line protocol over HTTP
Workers execute inside V8 isolates, and HTTP fetch() is the most natural networking primitive. GreptimeDB's InfluxDB-compatible endpoint accepts line protocol over HTTP, so no special client libraries are needed.
We use the @influxdata/influxdb-client-browser package for its Point class only (the SDK's WriteApi silently drops writes in Workers), then POST via raw fetch():
typescript
import { Point } from "@influxdata/influxdb-client-browser";

async function logEvent(
  env: Env,
  req: Request,
  res: Response,
  latencyMs: number
): Promise<void> {
  const cf = req.cf;
  const colo = (cf?.colo as string) ?? "DEV";
  const country = (cf?.country as string) ?? "XX";
  const pathGroup = normalizePathGroup(new URL(req.url).pathname);

  const point = new Point("worker_events")
    .tag("colo", colo)
    .tag("country", country)
    .tag("http_method", req.method)
    .intField("http_status", res.status)
    .floatField("latency_ms", latencyMs)
    .stringField("path_group", pathGroup)
    .stringField("cf_ray", req.headers.get("cf-ray") ?? "")
    .timestamp(BigInt(Date.now()) * 1_000_000n); // nanoseconds

  const line = point.toLineProtocol();
  if (!line) return;

  const url = `${env.GREPTIME_URL}/v1/influxdb/api/v2/write`
    + `?org=greptime&bucket=${env.GREPTIME_DB}&precision=ns`;

  await fetch(url, {
    method: "POST",
    headers: { "Content-Type": "text/plain; charset=utf-8" },
    body: line,
  });
}
Key points: GreptimeDB maps InfluxDB tags to primary key columns, so only tag low-cardinality dimensions (colo, country, http_method). Timestamps are converted from milliseconds to nanoseconds via BigInt. The write runs inside ctx.waitUntil() so it doesn't block the response.
Path normalization
URL paths with embedded IDs (/api/users/42) create high-cardinality values. The demo's normalizePathGroup() collapses UUIDs, numeric IDs, and long hex strings into :uuid, :id, and :hex respectively. In production, use your router's pattern matcher instead.
Authentication
When GreptimeDB requires authentication, add an Authorization: token user:pass header. Store credentials as Wrangler secrets (wrangler secret put GREPTIME_USERNAME). See the demo source for the full implementation.
The read path: Hyperdrive + postgres.js
Each Worker invocation is short-lived; without pooling, every request pays for a new TCP+TLS handshake. Hyperdrive maintains a connection pool close to your database. GreptimeDB speaks PostgreSQL wire protocol, and Hyperdrive supports PostgreSQL-compatible databases (CockroachDB, Timescale, etc.) — GreptimeDB fits the same pattern.
When connecting to GreptimeDB, postgres.js needs three specific settings:
typescript
const sql = postgres(env.HYPERDRIVE.connectionString, {
  max: 5,          // Workers' concurrent external connection limit
  fetch_types: false, // skip pg_type bootstrap (limited in GreptimeDB)
  prepare: false,     // simple-query protocol (GreptimeDB PG wire compat)
});
prepare: false together with sql.unsafe() for raw SQL is the most compatible approach today; the PG wire compatibility issue is tracked in GreptimeDB #8050.
Queries use standard SQL with GreptimeDB functions — the demo's /_stats endpoint uses approx_percentile_cont() for p95 latency and CASE WHEN for error counts. See the full source.
Schema design
sql
CREATE TABLE IF NOT EXISTS worker_events (
    ts          TIMESTAMP(9) TIME INDEX,
    colo        STRING,
    country     STRING,
    http_method STRING,
    path_group  STRING,
    http_status BIGINT,
    latency_ms  DOUBLE,
    bytes_out   BIGINT,
    cf_ray      STRING,
    ua          STRING,
    full_path   STRING,
    PRIMARY KEY (colo, country, http_method)
) WITH (ttl = '30d', append_mode = 'true');
append_mode = 'true' is the most important setting — without it, two requests sharing the same timestamp and primary key values deduplicate into one row. Since ts has millisecond precision in practice, burst traffic easily produces collisions. Append mode ensures each write creates a distinct row and benefits performance for log-style workloads.
With append_mode = 'true', the primary key no longer deduplicates rows; it only controls on-disk clustering. GreptimeDB sorts rows by primary key columns left to right, so columns earlier in the key are most efficient for equality-filter scans.
colo is placed first because the most common queries filter by colo (the demo's /_stats?colo=LAX is the typical pattern); country and http_method follow as drill-down dimensions. All three are low-cardinality (a few hundred colos, under 300 countries, a handful of methods), so the combined PK fan-out is manageable and the row count is already small after filtering by these three columns. Whether to add a higher-cardinality column to the PK depends on whether the leading columns filter enough: adding it doesn't hurt clustering, but it does carry extra storage cost. Here the first three columns already narrow scans enough, so path_group stays as a field column. ttl = '30d' auto-expires old data; for higher volumes, add data partitioning.
Example queries
Once events are flowing, you can run SQL analytics directly. Two typical examples:
Request rate per minute by colo:
sql
SELECT
    date_bin('1 minute'::INTERVAL, ts) AS minute,
    colo,
    count(*) AS requests
FROM worker_events
WHERE ts > now() - INTERVAL 1 HOUR
GROUP BY minute, colo
ORDER BY minute DESC;
Drill into recent errors:
sql
SELECT ts, http_status, colo, full_path, latency_ms, cf_ray
FROM worker_events
WHERE http_status >= 400
  AND ts > now() - INTERVAL 15 MINUTE
ORDER BY ts DESC
LIMIT 50;
More query examples (latency percentiles, error rate timelines, etc.) are in the demo's queries.sql. These queries work via GreptimeDB's HTTP API, PostgreSQL wire interface, or Grafana. The demo ships with a pre-provisioned Grafana dashboard (connected via MySQL protocol) at http://localhost:3000.
Worker configuration
The Worker is configured through wrangler.toml (or wrangler.jsonc in newer projects):
toml
name = "greptime-edge-logger"
main = "src/index.ts"
compatibility_date = "2024-11-11"
compatibility_flags = ["nodejs_compat"]

[vars]
GREPTIME_URL = "http://greptimedb:4000"
GREPTIME_DB = "public"
ORIGIN_URL = "http://origin:8080"
MEASUREMENT = "worker_events"

[[hyperdrive]]
binding = "HYPERDRIVE"
# Placeholder for the local demo. Replace with your real Hyperdrive ID before `wrangler deploy` / production use.
id = "00000000000000000000000000000000"
localConnectionString = "postgres://greptime:greptime@greptimedb:4003/public"
nodejs_compat is required because postgres.js relies on node:crypto, node:buffer, and other Node APIs.
Deploying to the real edge
The demo runs locally, but deploying to Cloudflare's edge is straightforward. The quickest test is to expose your local GreptimeDB via a quick tunnel (cloudflared tunnel --url http://localhost:4000), then npx wrangler deploy. Check that cf_ray is non-empty in the resulting rows — that's proof the request went through the edge network.
For production with both reads and writes, GreptimeDB needs to be reachable from Cloudflare's network. A common approach is a Cloudflare named tunnel exposing both HTTP and PG wire ports, then creating a Hyperdrive binding. The full step-by-step is in the demo's DEPLOY.md.
Production considerations
Batching writes. One write per request works at moderate scale. For higher throughput, route events through Cloudflare Queues and have a consumer Worker batch-POST to GreptimeDB. This follows the Workers best practice of using Queues for non-blocking background work.
Sampling. At high volumes, keep all errors (4xx, 5xx) and sample 2xx responses (e.g. 10%). Latency distributions remain statistically useful while storage drops substantially.
TTL and partitioning. The demo uses ttl = '30d'. For higher volumes, add data partitioning.
Why not @greptime/ingester? The official TypeScript ingester depends on @grpc/grpc-js, which requires net and http2 — unavailable in Workers even with nodejs_compat. A fetch-based ingester is on the SDK roadmap.
Summary
GreptimeDB gives Cloudflare Workers a practical event and metric store — filling the space between "use D1" and "run a full observability pipeline." Writes use InfluxDB line protocol over HTTP, reads go through Hyperdrive + postgres.js, and the schema uses low-cardinality primary keys with append_mode and TTL. The demo repository has the complete code — docker compose up -d and you're running.


